 Grafana: How to configure Prometheus as a data source in Grafana
This documentation is part of the Using Prometheus guide. You can view the complete guide here: How to configure Grafana to use Prometheus as a data source.
👋 Welcome to the Stackhero documentation!
Stackhero offers a ready-to-use Grafana cloud solution that provides a host of benefits, including:
- Unlimited users, dashboards, and alerts.
- Unlimited and dedicated SMTP email server included.
- Plugins installable in one click.
- Seamless SSO support, compatible with
GitLab,GitHub,OAuth2protocols.- Effortless updates with just a click.
- Customizable domain name secured with HTTPS (for example, https://grafana.your-company.com).
- Optimal performance and robust security powered by a private and dedicated VM.
Save time and simplify your life: it only takes 5 minutes to try Stackhero's Grafana cloud hosting solution!
Integrating Prometheus with Grafana enhances your ability to visualize metrics effectively. Follow this guide for a straightforward setup process.
Accessing the data source configuration
- Open the Grafana web user interface (UI).
- Navigate to
Configuration>Data Sources. - Click on
Add Data Source. - From the list of available sources, select
Prometheus.
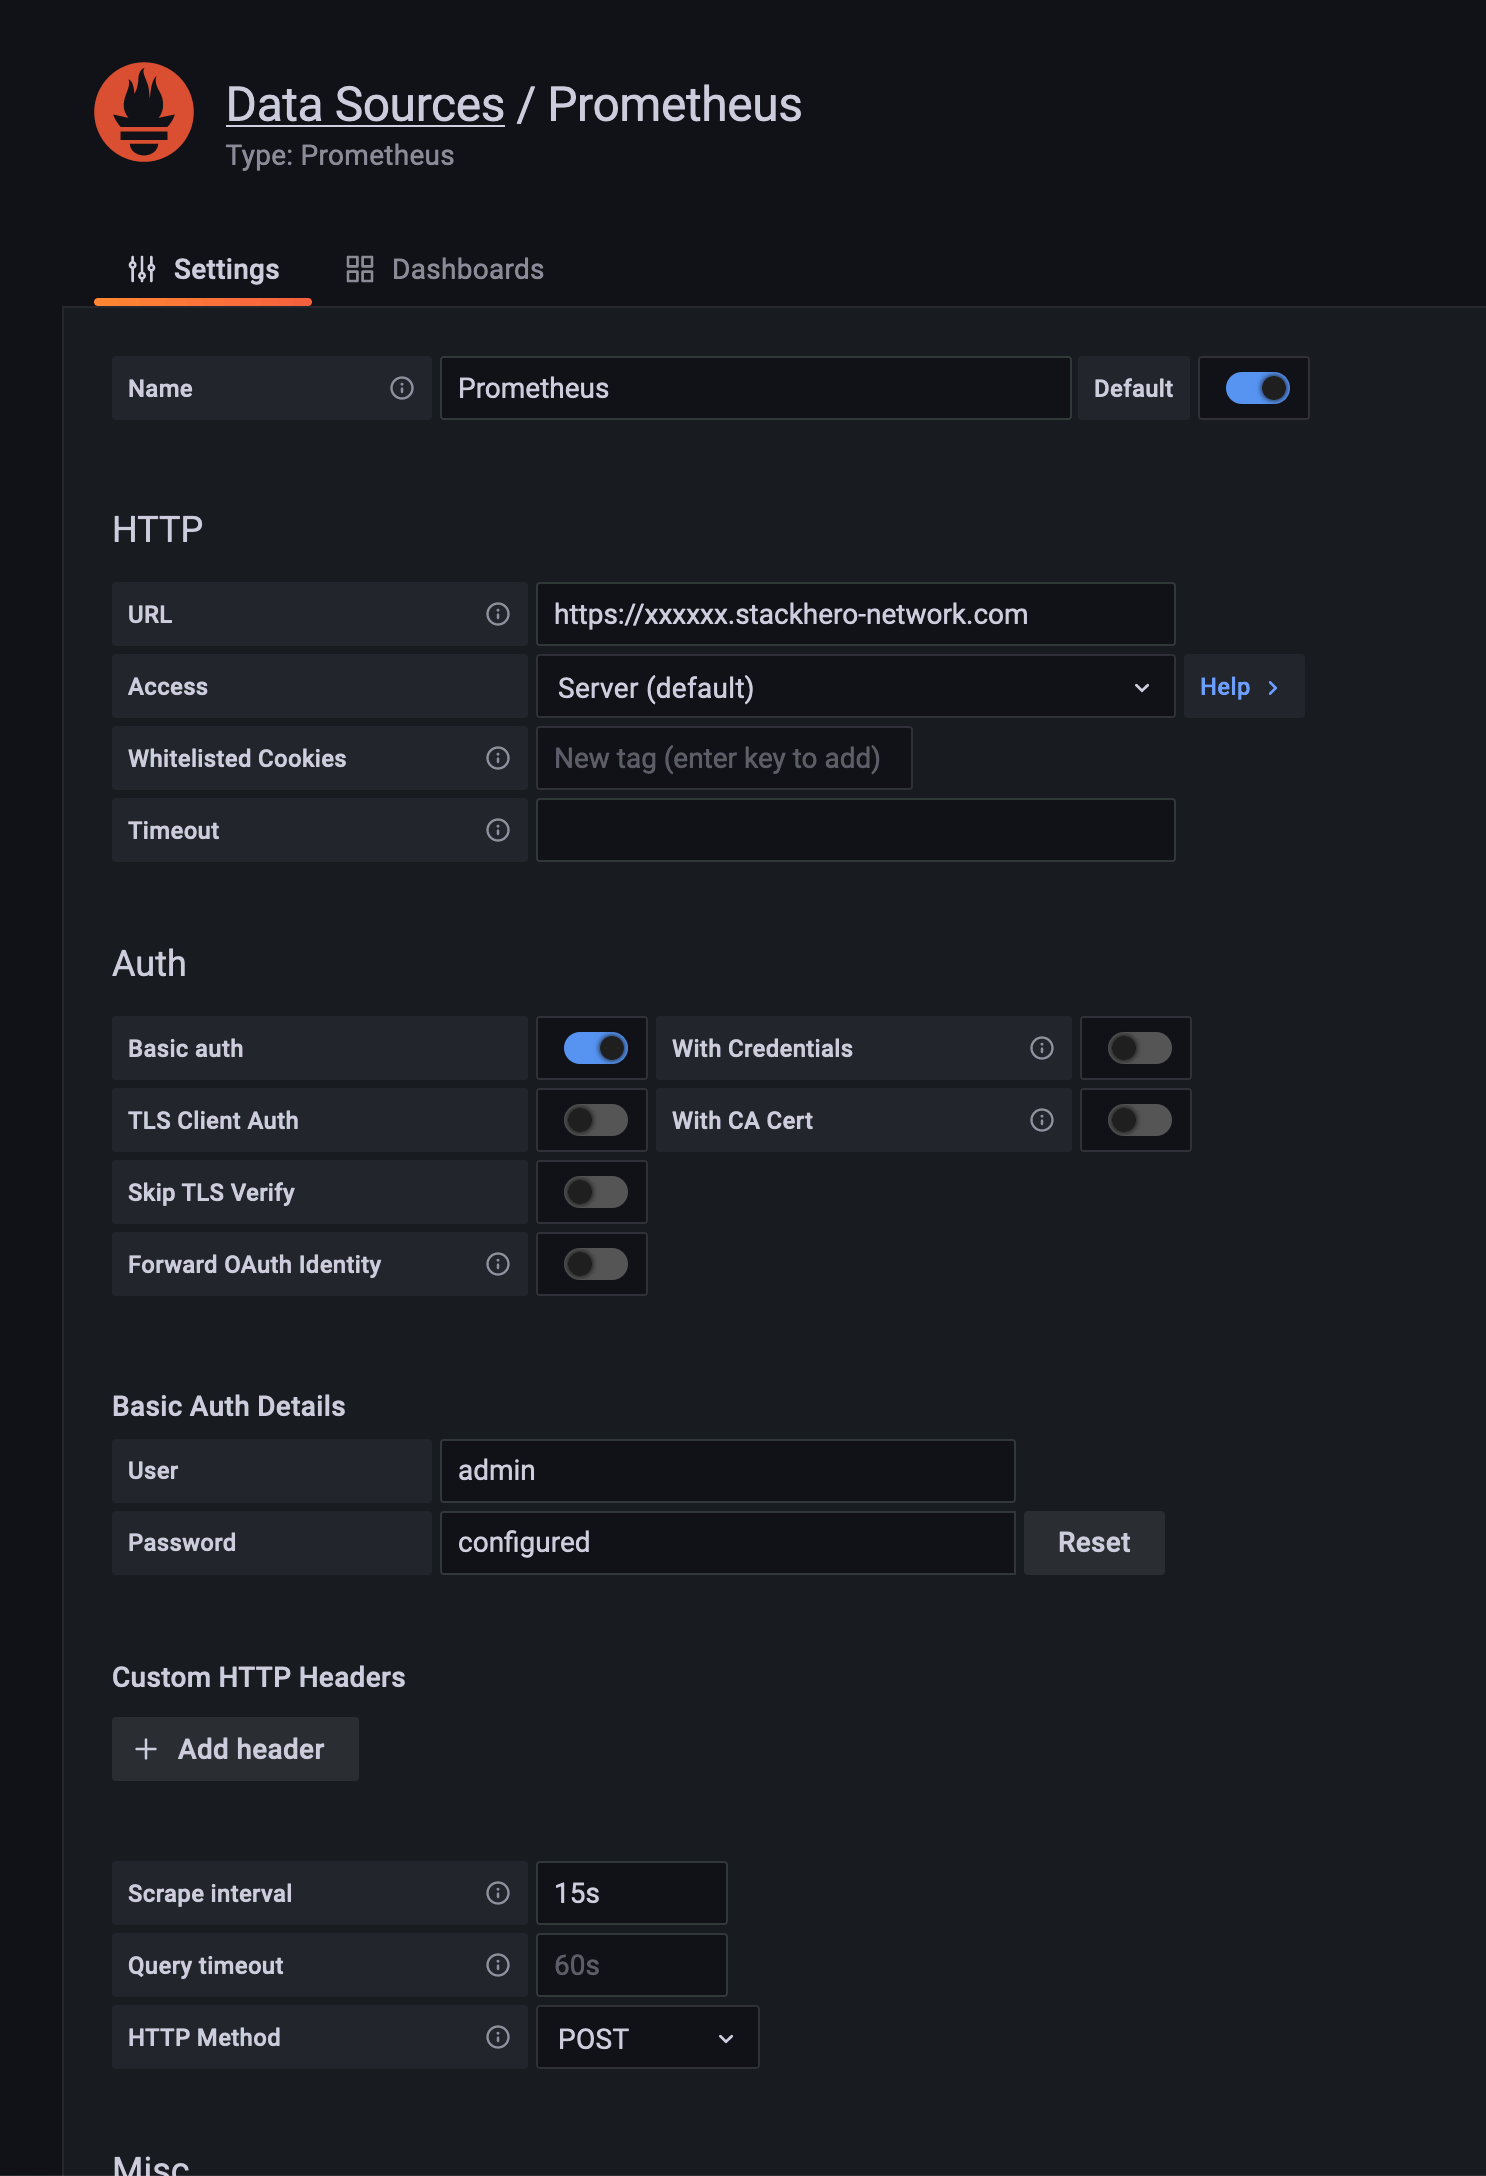 Example of Prometheus configuration as data source
Configuring the Prometheus data source
Follow these steps to properly set up Prometheus as a data source:
- URL: Provide the Prometheus service URL, such as
https://<XXXXXX>.stackhero-network.comor your custom domain. - Authentication: Enable
Basic Auth, setadminas the username, and provide your Prometheus password. You can find this password in the Stackhero dashboard under the Prometheus service settings. - Scrape Interval: Ensure the
Scrape Intervalaligns with your Prometheus server configuration. The default is15sunless it has been adjusted.
After entering these details, click Save & Test to verify the connection is functional.