 Prometheus: Configuring Grafana to display Prometheus data from the Blackbox Exporter
This documentation is part of the Blackbox Exporter guide. You can view the complete guide here: How to use Prometheus Blackbox Exporter to probe HTTP and ICMP (ping) endpoints.
👋 Welcome to the Stackhero documentation!
Stackhero offers a ready-to-use Prometheus cloud solution designed for reliability and ease of use:
Alert Manageris included, allowing you to send alerts directly toSlack,Mattermost,PagerDuty, and other popular platforms.- A dedicated email server lets you send unlimited email alerts with no additional setup required.
Blackboxis included, so you can probeHTTP,ICMP,TCP, and more for comprehensive monitoring.- Simple configuration with the online configuration file editor—no need to manage YAML manually.
- Easy updates with just one click. Stackhero takes care of the upgrade process for you.
- Optimal performance and enhanced security thanks to your own private, dedicated VM.
Save time and make your life easier: it only takes 5 minutes to try Stackhero's Prometheus cloud hosting solution!
Grafana makes it easy to create dashboards that visualize the performance and availability metrics collected by the Blackbox Exporter. With just a few clicks, you can set up dynamic dashboards that bring your Prometheus data to life. For more details on integrating Grafana with Prometheus, you might explore Grafana's documentation.
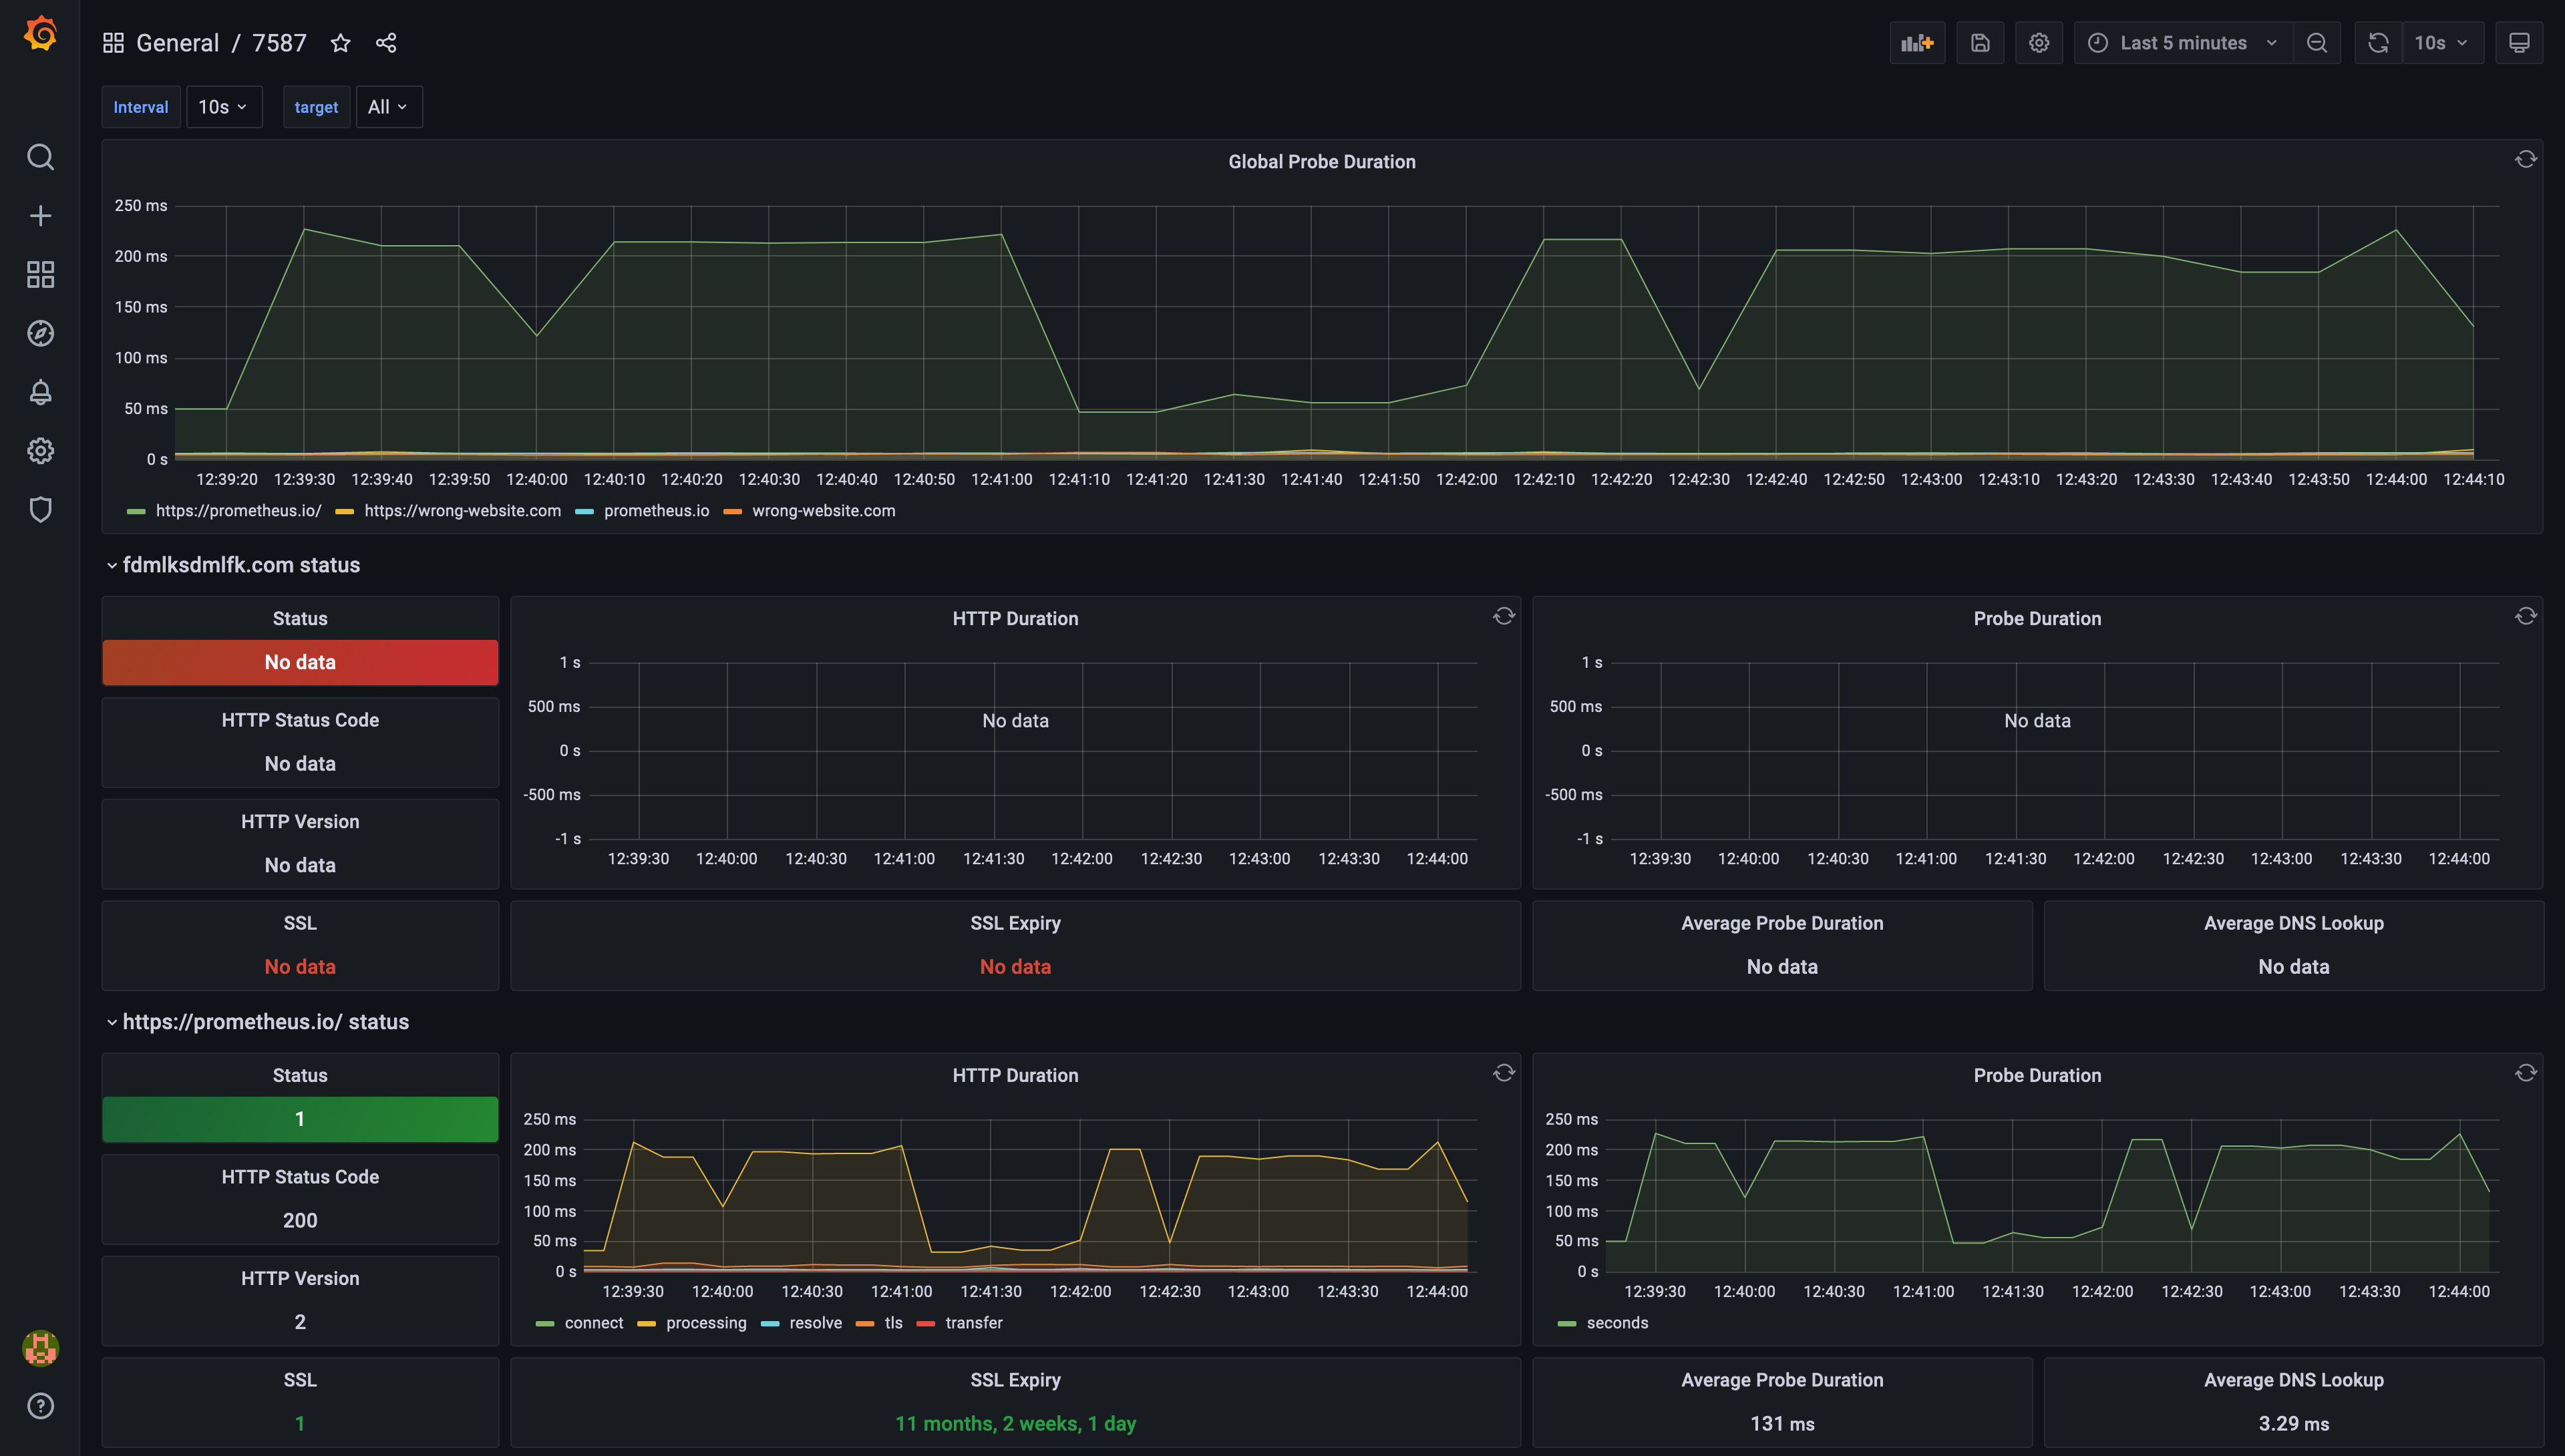 Example of a dashboard generated by Grafana, based on Prometheus Blackbox Exporter data