 Grafana: Getting started
How to get started with Grafana
👋 Welcome to the Stackhero documentation!
Stackhero provides you with a ready-to-use Grafana cloud environment, designed for rapid deployment and reliable performance:
- Unlimited users, dashboards, and alerts: scale your monitoring as required, with no artificial restrictions.
- A dedicated SMTP email server is included, allowing you to send as many notifications as you need, with no quotas to monitor.
- One-click plugin installation makes it easy to add new features to Grafana.
- Built-in SSO support for
GitLab,GitHub,OAuth2provider. User management remains straightforward and secure.- One-click updates ensure your Grafana instance stays up to date, with no downtime or maintenance headaches.
- Use your own custom domain with automated HTTPS provisioning for secure, branded access (for example, https://grafana.your-company.com).
- High performance and enhanced security come as standard, running on your own private, dedicated infrastructure.
Get started more quickly and save time on setup: a secure Grafana cloud hosting instance is ready in around 5 minutes.
Connecting Grafana to InfluxDB v2
Before you begin, ensure you are using Grafana v7.0.0 or later. Since Stackhero regularly updates its services, this should not be a concern.
Log in to your Grafana web panel and navigate to Configuration / Data sources / Add a data source. Choose the data source labelled "InfluxDB". In the "Query language" dropdown, select "Flux". This step is essential because InfluxDB v2 uses the Flux query language.
Next, provide the URL, organisation, and token details (you can refer to the "InfluxDB" / "Getting started" documentation on the left to learn how to create a token).
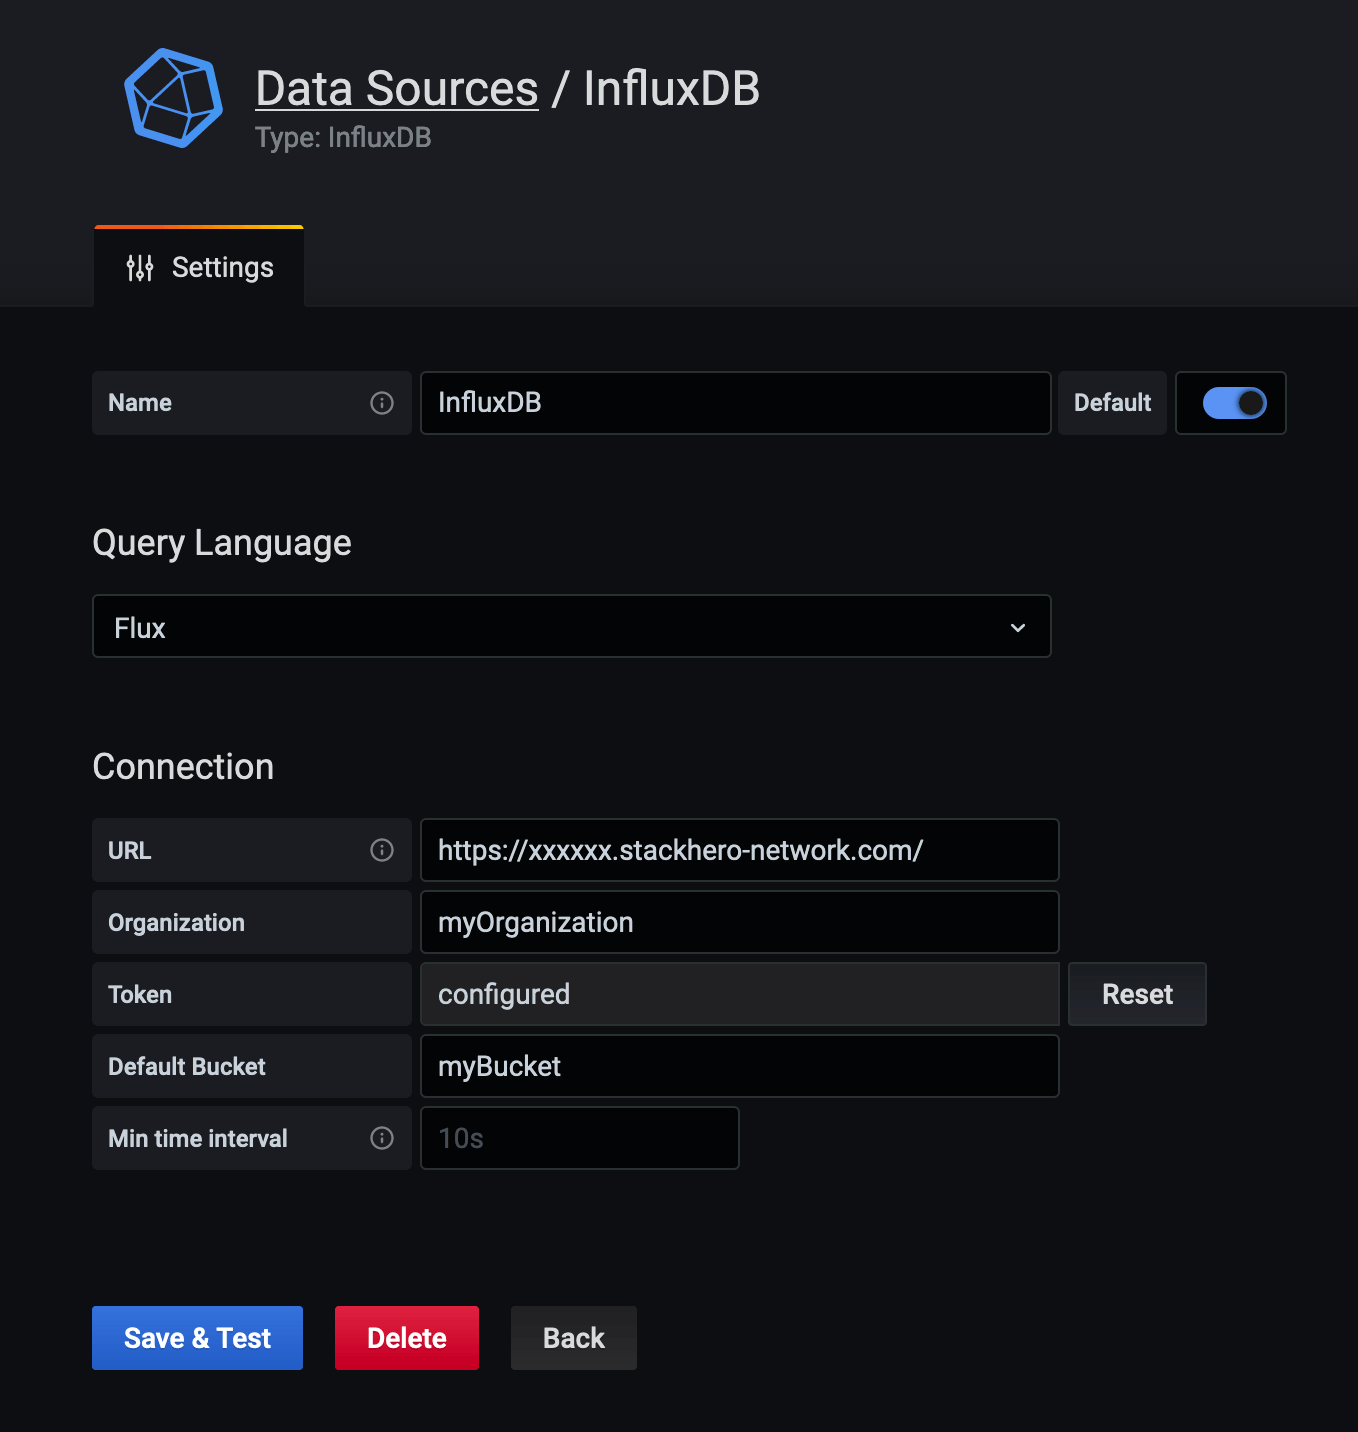 InfluxDB data source configuration
Handle error "parse error on line 1, column 1: bare " in non-quoted-field" with InfluxDB v2
If you encounter the error "parse error on line 1, column 1: bare " in non-quoted-field" with Grafana 7.2.0, you can resolve it by editing your data source.
Log in to Grafana, go to your data sources, select "InfluxDB", and update the URL by replacing:
https://<XXXXXX>.stackhero-network.com/api/v2
with
https://<XXXXXX>.stackhero-network.com/
After making this change, click on "Save & test". The connection should now work as expected.
Connecting Grafana to PostgreSQL
Log in to your Grafana web panel and navigate to Configuration / Data sources / Add a data source.
Select the data source labelled "PostgreSQL" and complete the form with the following information:
- In "Host", enter your PostgreSQL service domain (for example,
<XXXXXX>.stackhero-network.com:5432). - In "Database", enter your PostgreSQL database name (by default, this is
admin). - In both "User" and "Password", enter your PostgreSQL credentials (the default user is
adminand the password is the one specified in your PostgreSQL service configuration).
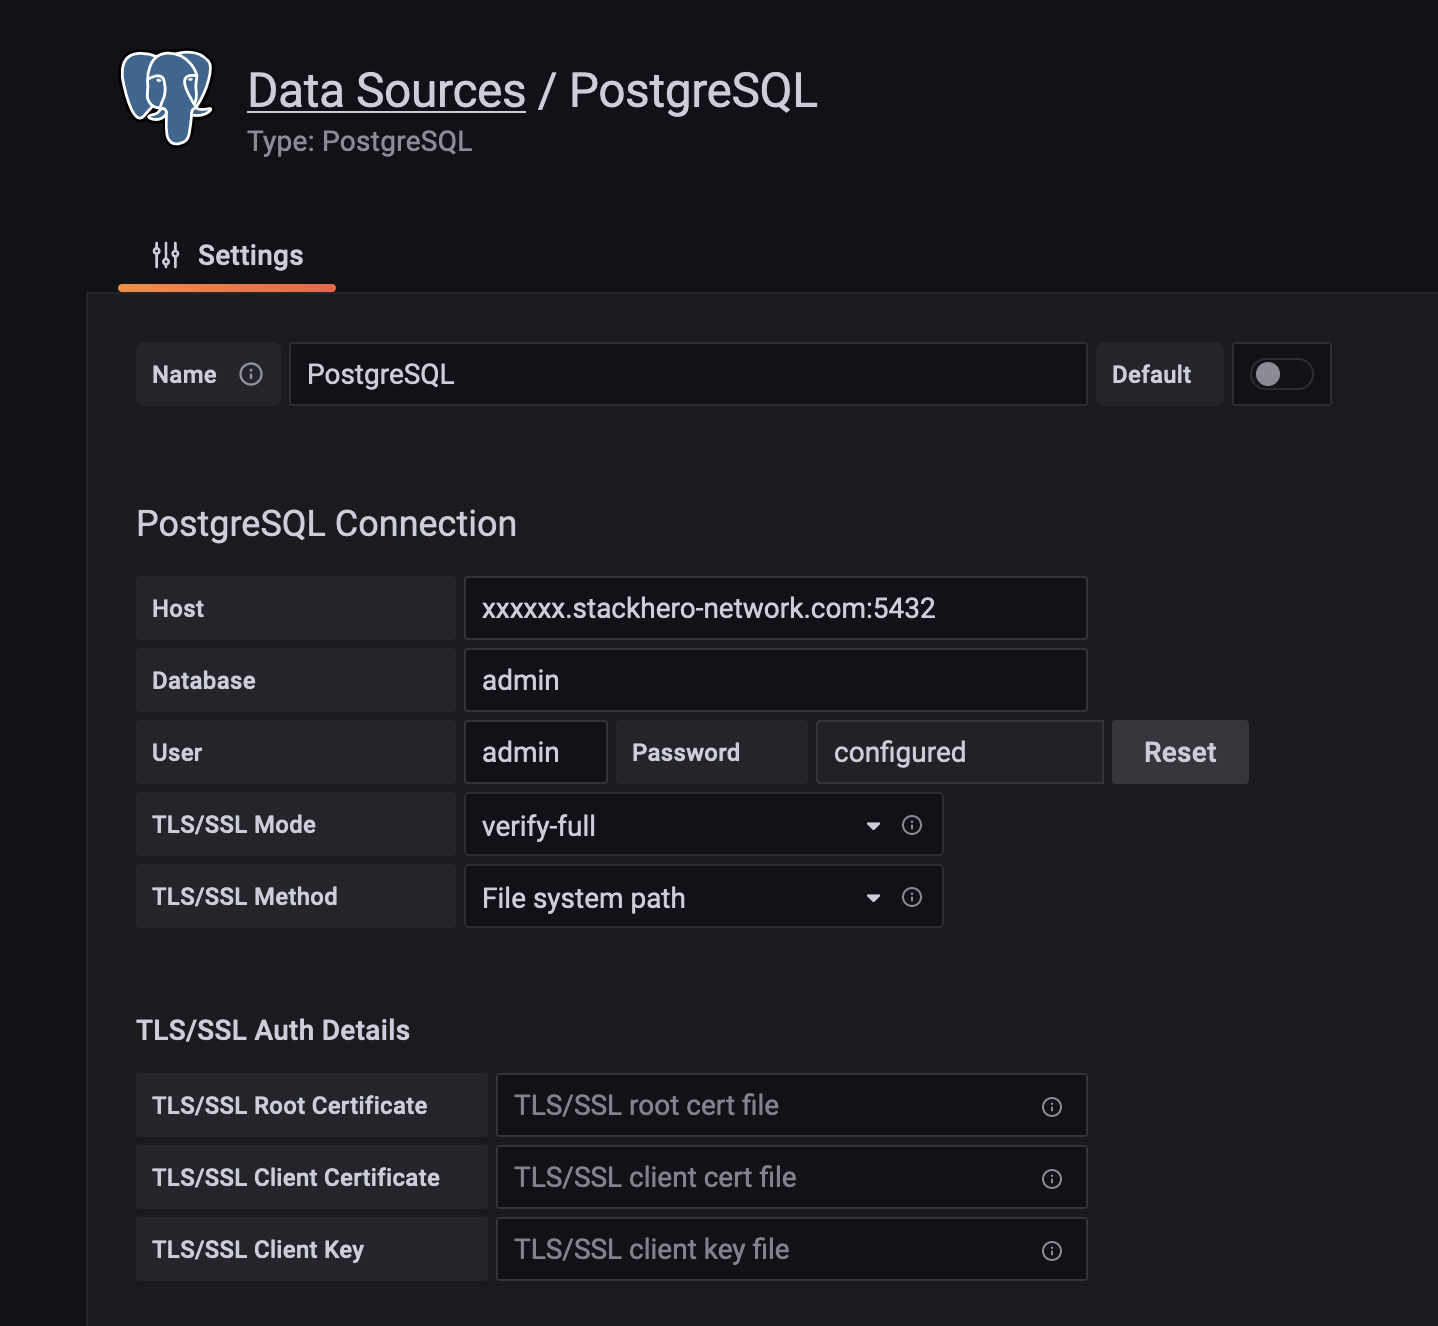 PostgreSQL data source configuration
Adding plugins to Grafana
You can enhance Grafana by adding plugins from Grafana's marketplace. To add a plugin, log in to your Stackhero dashboard, click on "Configure", then "Add a plugin". Next, copy and paste the URL of the plugin you wish to install. For example, if you want to install the "Worldmap Panel" plugin, paste the following URL:
https://grafana.com/grafana/plugins//grafana-worldmap-panel
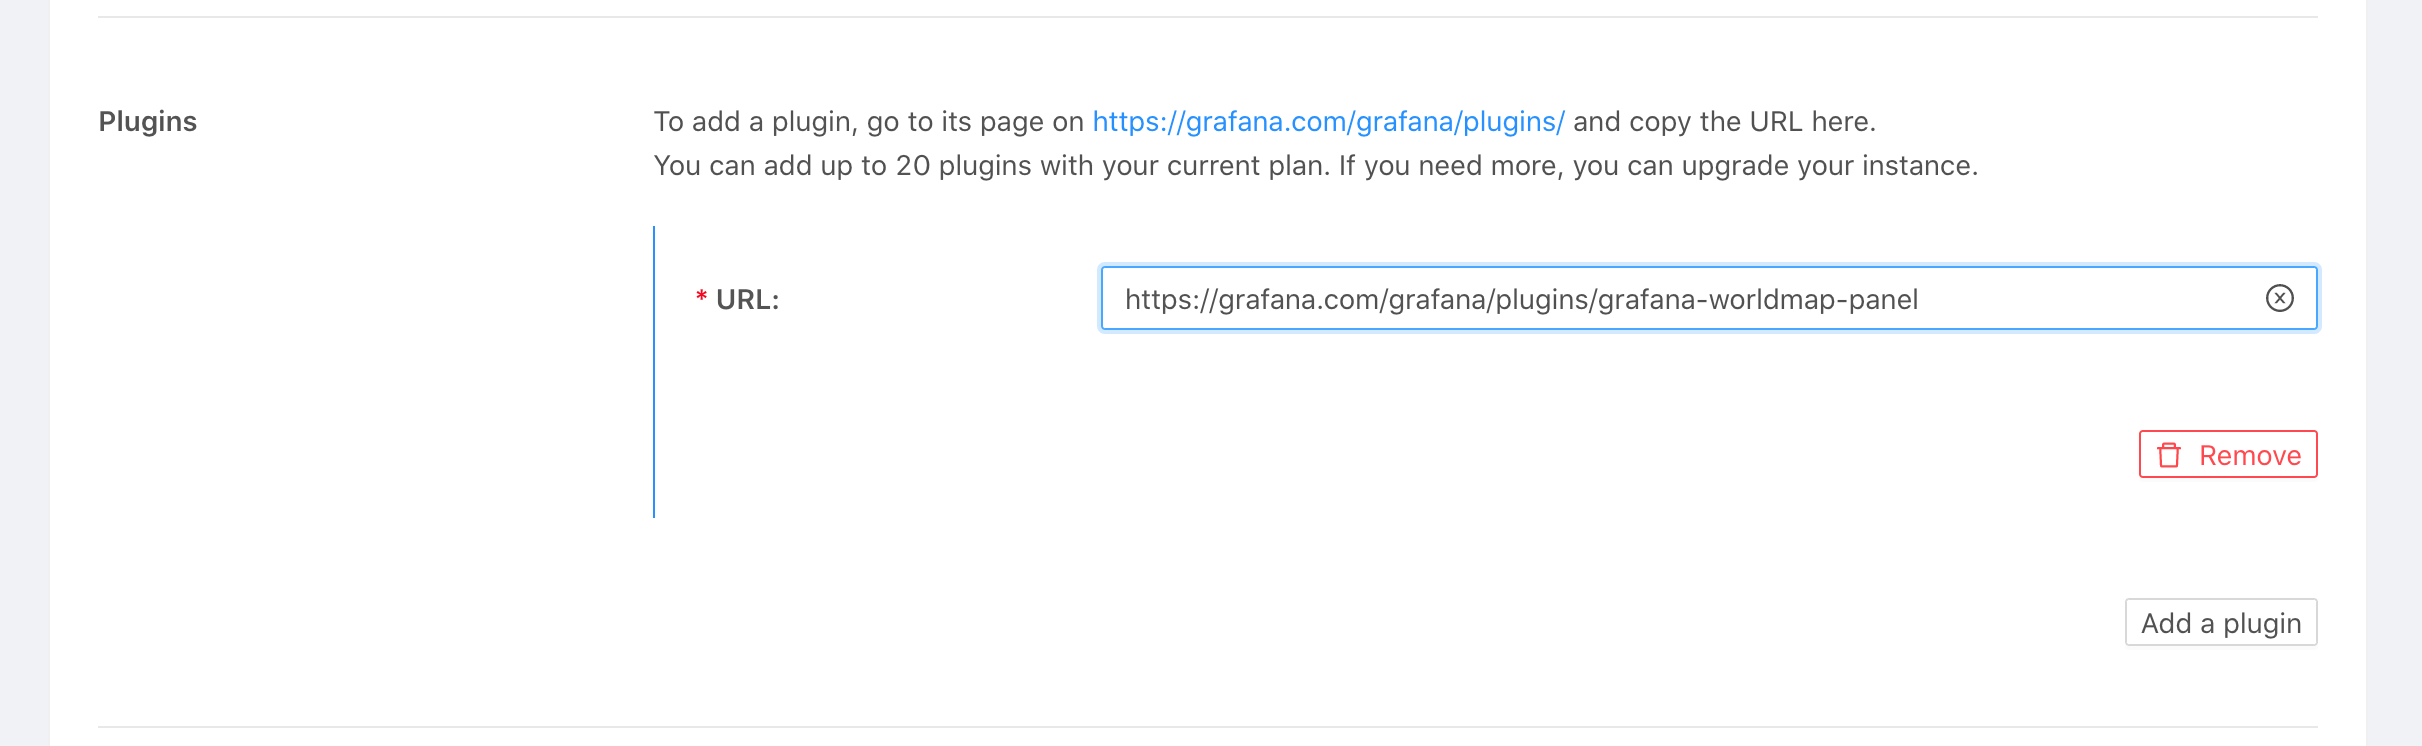 Example of plugin installation
Enjoy customising your Grafana experience with these new tools!