 Grafana: Adding a Node Exporter dashboard
This documentation is part of the Using Prometheus guide. You can view the complete guide here: How to configure Grafana to use Prometheus as a data source.
👋 Welcome to the Stackhero documentation!
Stackhero offers a ready-to-use Grafana cloud solution that provides a host of benefits, including:
- Unlimited users, dashboards, and alerts.
- Unlimited and dedicated SMTP email server included.
- Plugins installable in one click.
- Seamless SSO support, compatible with
GitLab,GitHub,OAuth2protocols.- Effortless updates with just a click.
- Customisable domain name secured with HTTPS (for example, https://grafana.your-company.com).
- Optimal performance and robust security powered by a private and dedicated VM.
Save time and simplify your life: it only takes 5 minutes to try Stackhero's Grafana cloud hosting solution!
If your Prometheus server includes a Node Exporter target, you can quickly import a pre-built dashboard into Grafana to monitor its metrics:
- In the Grafana UI, navigate to
Create>Import. - Under
Import via grafana.com, input the ID1860and clickLoad. - Select your Prometheus data source.
- Click
Importto add the dashboard.
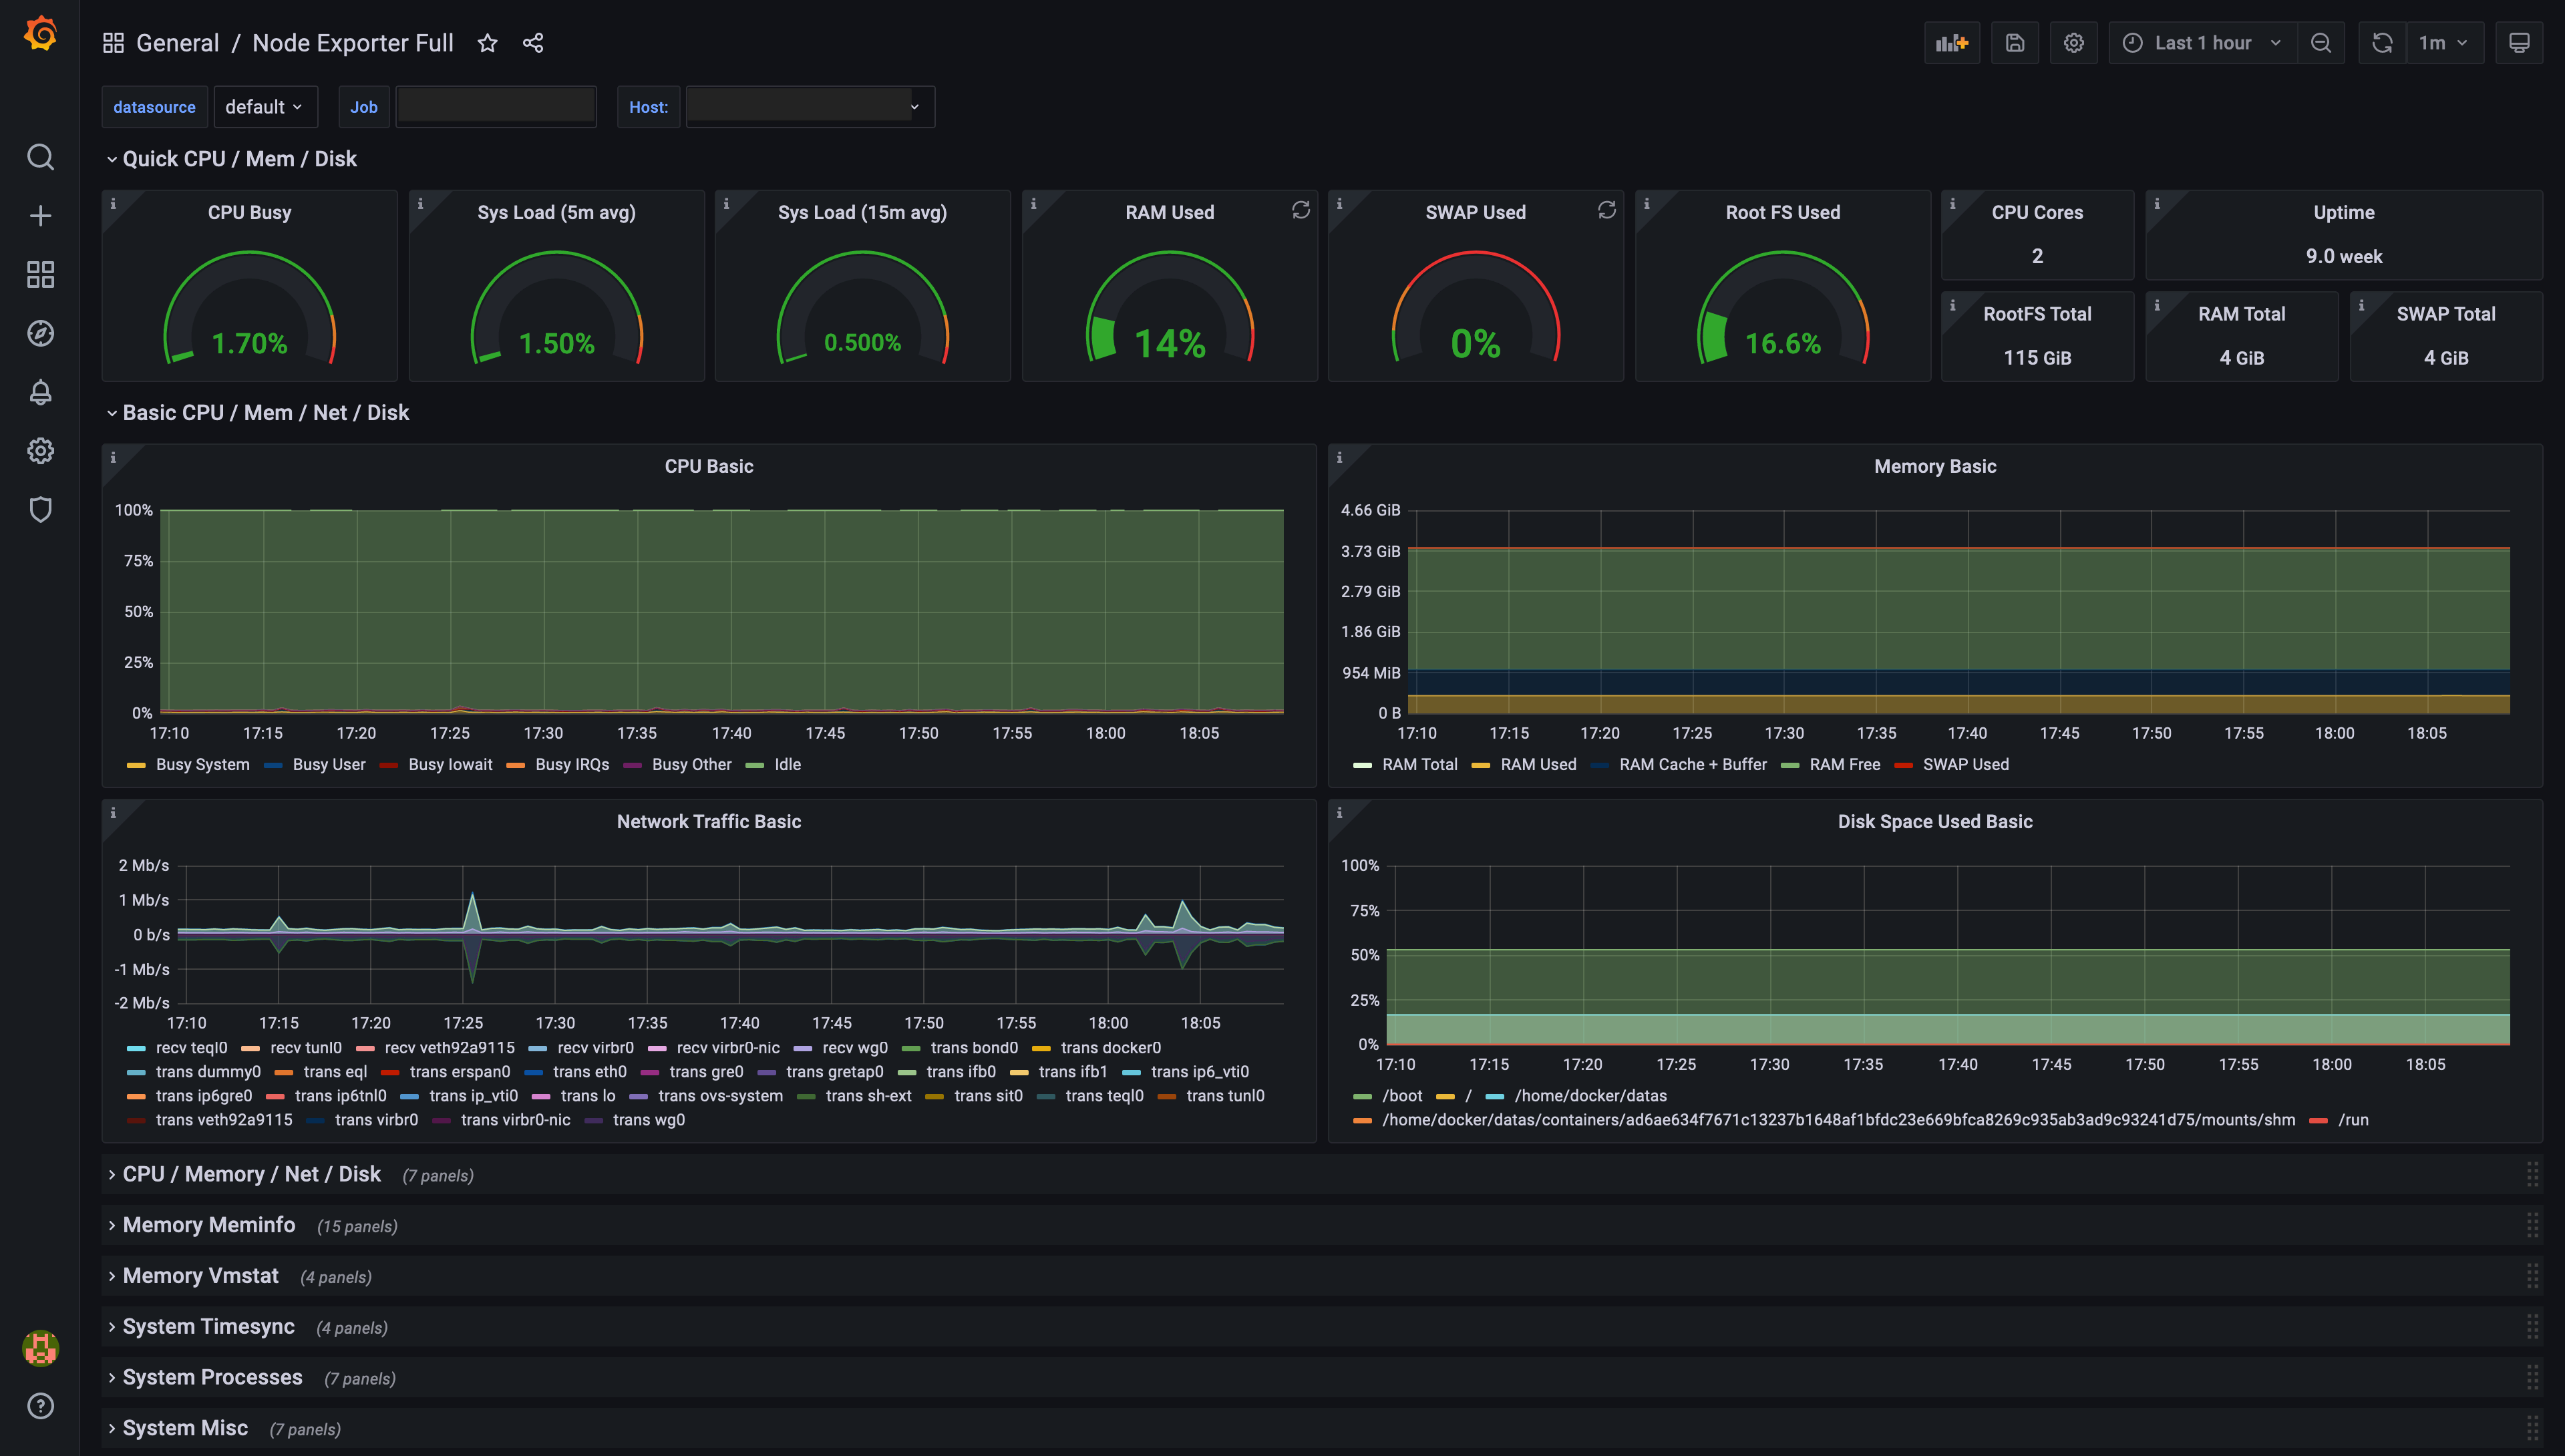 Example of a dashboard generated by Grafana, based on Prometheus Node Exporter data
You now have a Grafana dashboard displaying metrics from the Node Exporter. Use the Job selector in the top left to switch between instances.