 Grafana: Adding a Blackbox Exporter dashboard
This documentation is part of the Using Prometheus guide. You can view the complete guide here: How to configure Grafana to use Prometheus as a data source.
👋 Welcome to the Stackhero documentation!
Stackhero provides you with a ready-to-use Grafana cloud environment, designed for rapid deployment and reliable performance:
- Unlimited users, dashboards, and alerts: scale your monitoring as required, with no artificial restrictions.
- A dedicated SMTP email server is included, allowing you to send as many notifications as you need, with no quotas to monitor.
- One-click plugin installation makes it easy to add new features to Grafana.
- Built-in SSO support for
GitLab,GitHub,OAuth2provider. User management remains straightforward and secure.- One-click updates ensure your Grafana instance stays up to date, with no downtime or maintenance headaches.
- Use your own custom domain with automated HTTPS provisioning for secure, branded access (for example, https://grafana.your-company.com).
- High performance and enhanced security come as standard, running on your own private, dedicated infrastructure.
Get started more quickly and save time on setup: a secure Grafana cloud hosting instance is ready in around 5 minutes.
Grafana supports pre-configured dashboards for the Blackbox Exporter. To add one:
- In the Grafana UI, go to
Create>Import. - Enter one of the following IDs:
7587,11175,11529, or13659, and clickLoad. - Select your Prometheus data source and click
Import.
This process adds a dashboard designed for Blackbox Exporter data visualisation. Use the Job selector at the top left to focus on specific instances.
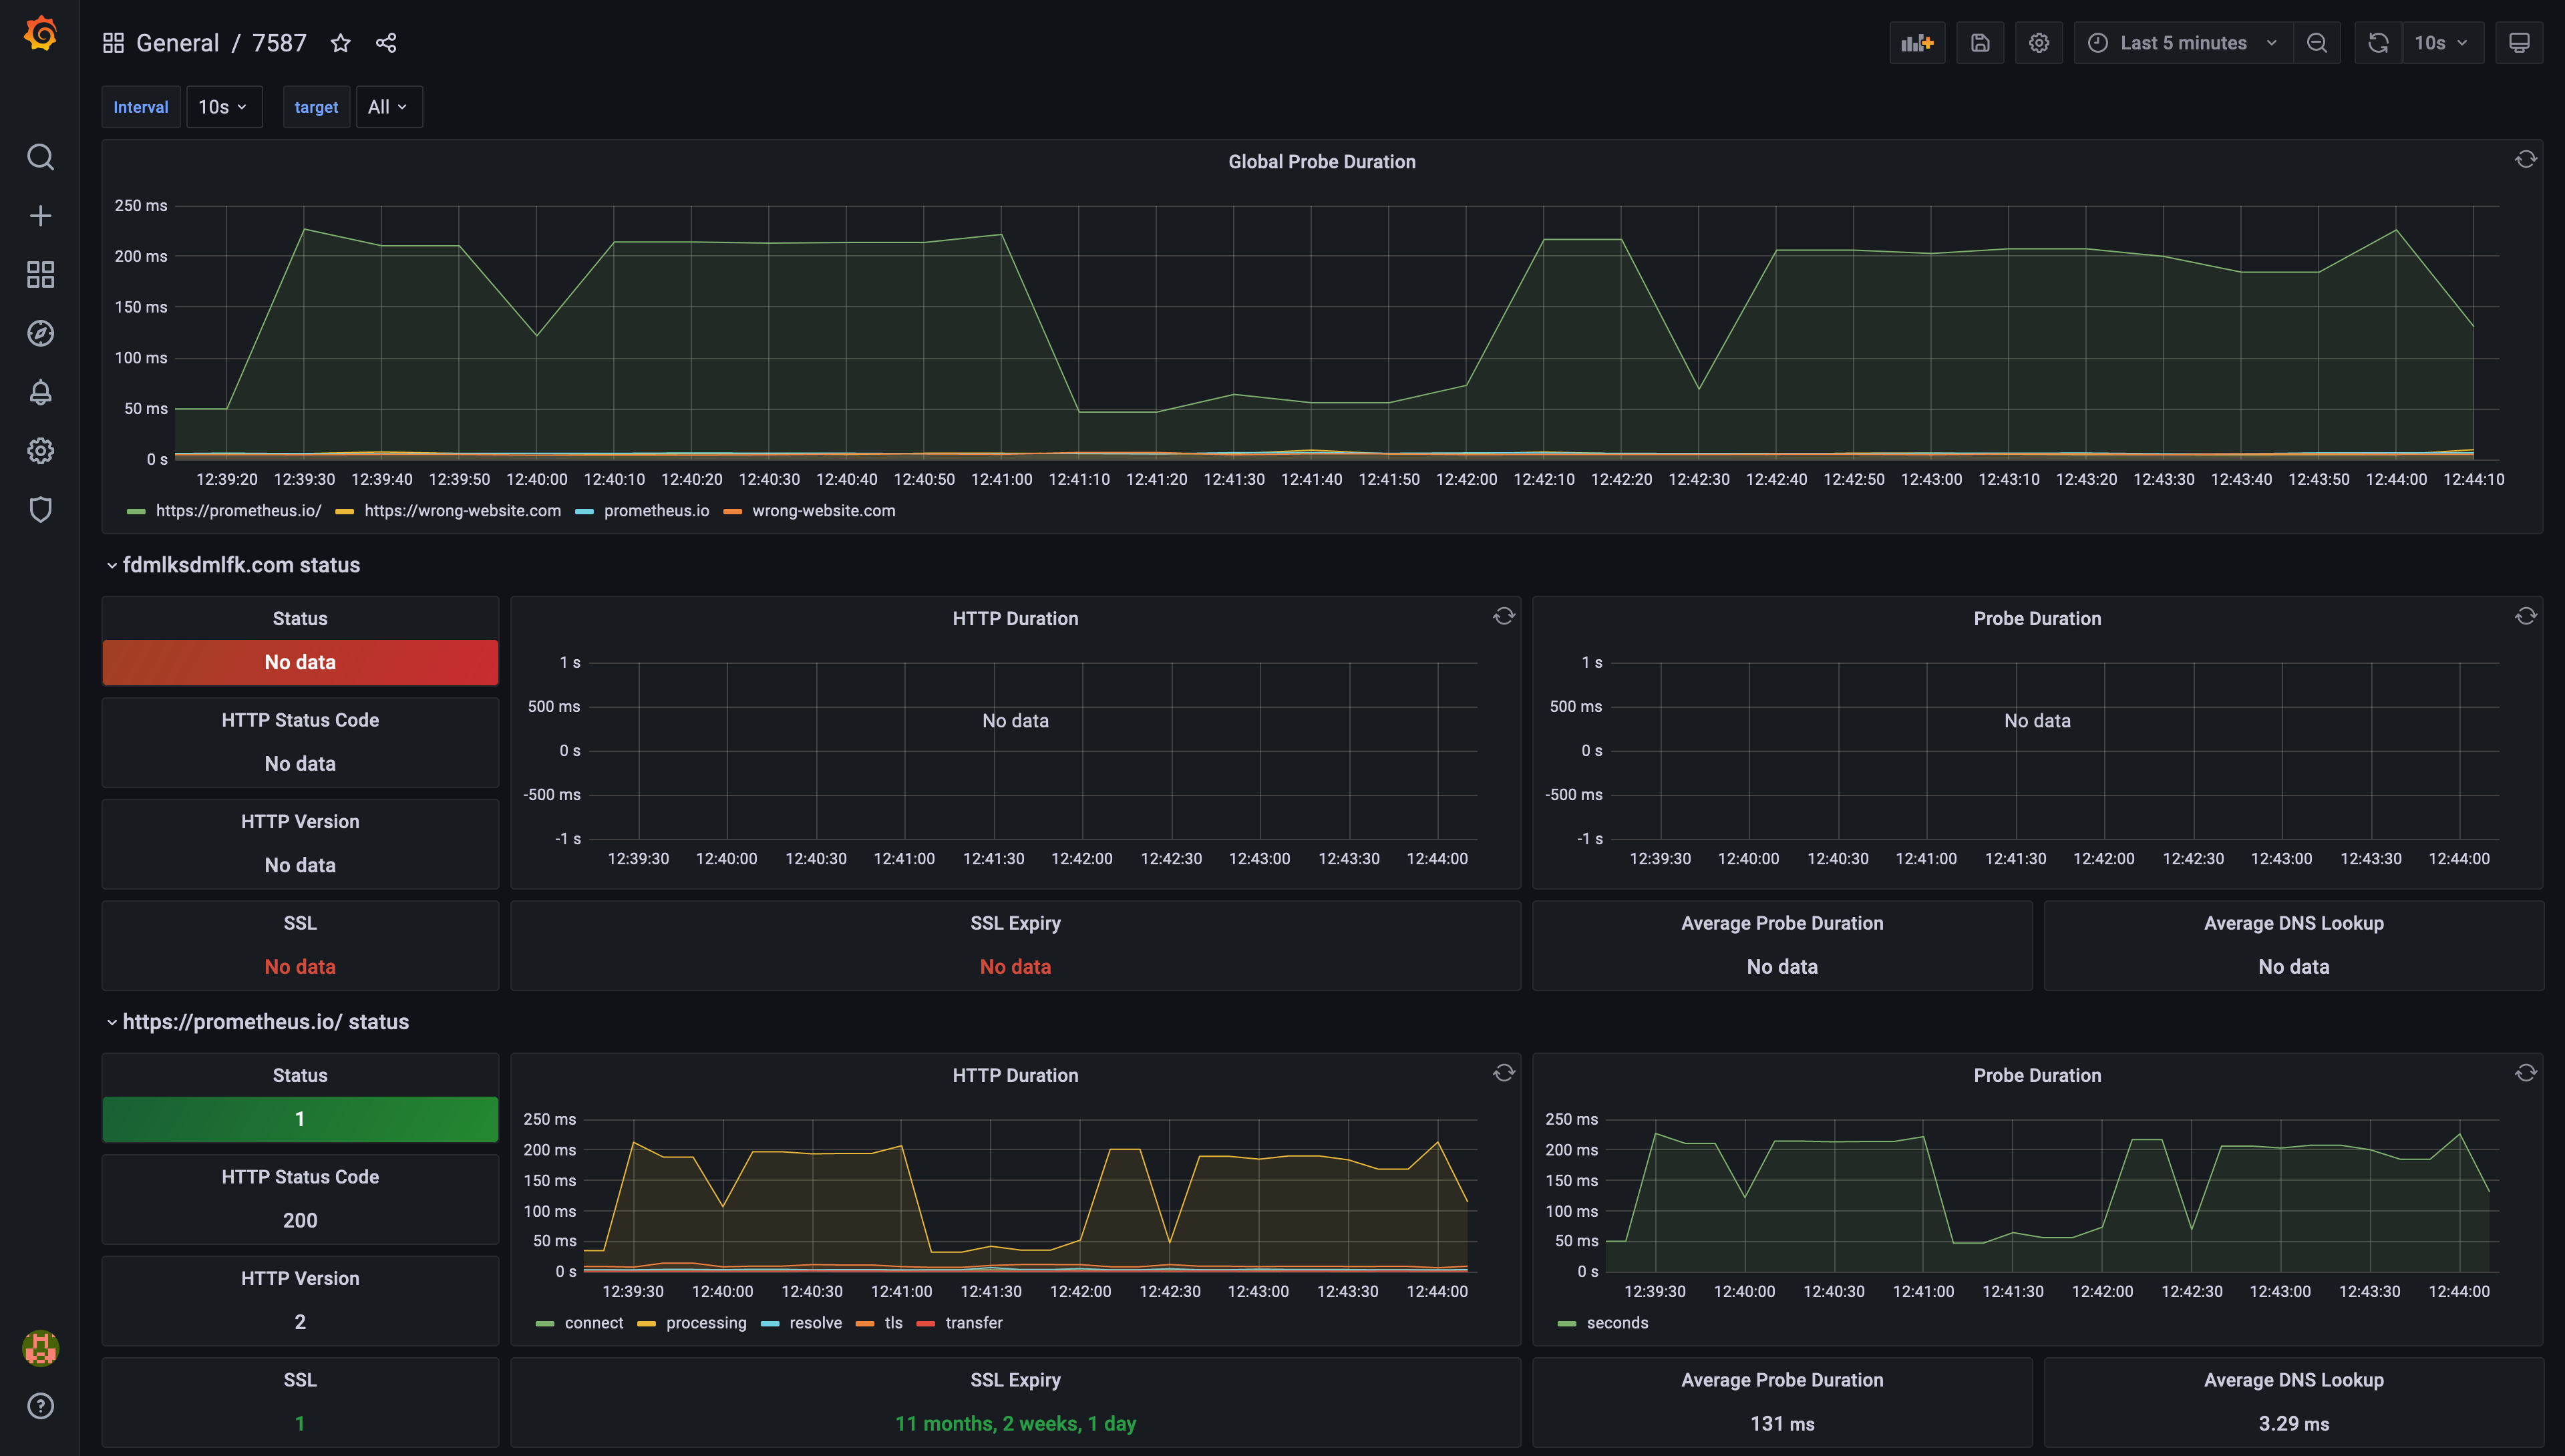 Example of pre-configured dashboard ID 7587
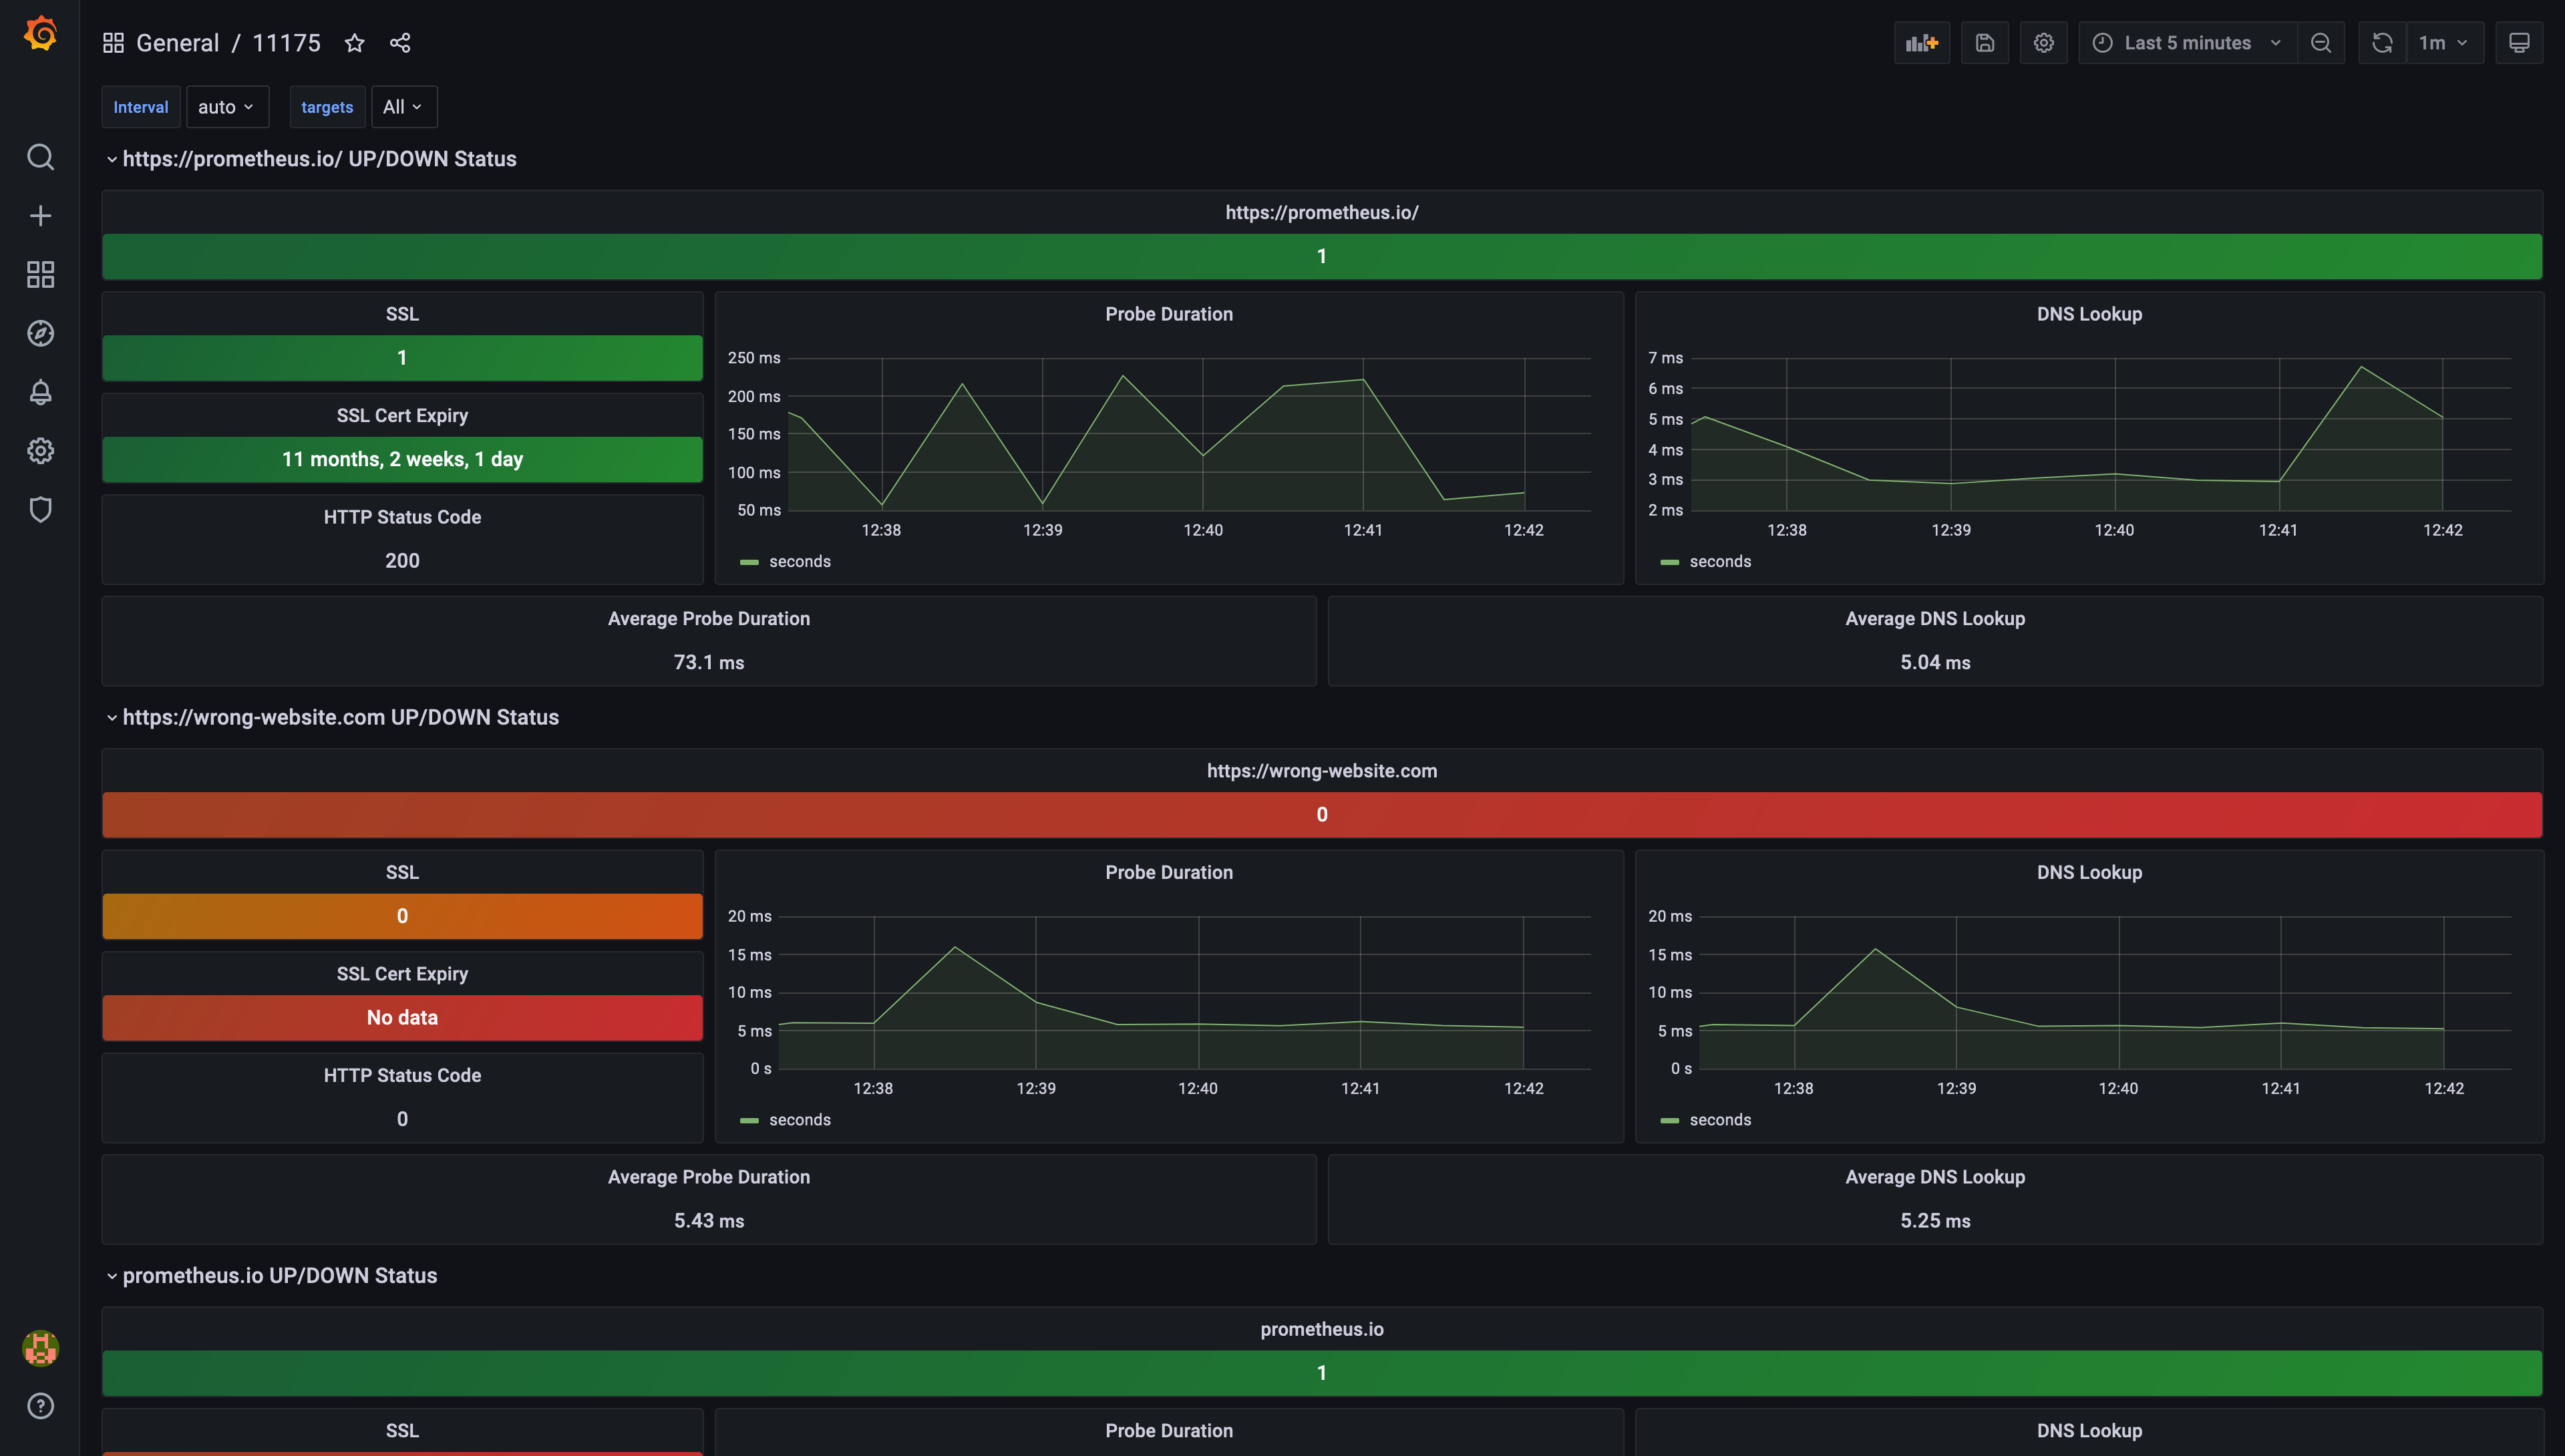 Example of pre-configured dashboard ID 11175
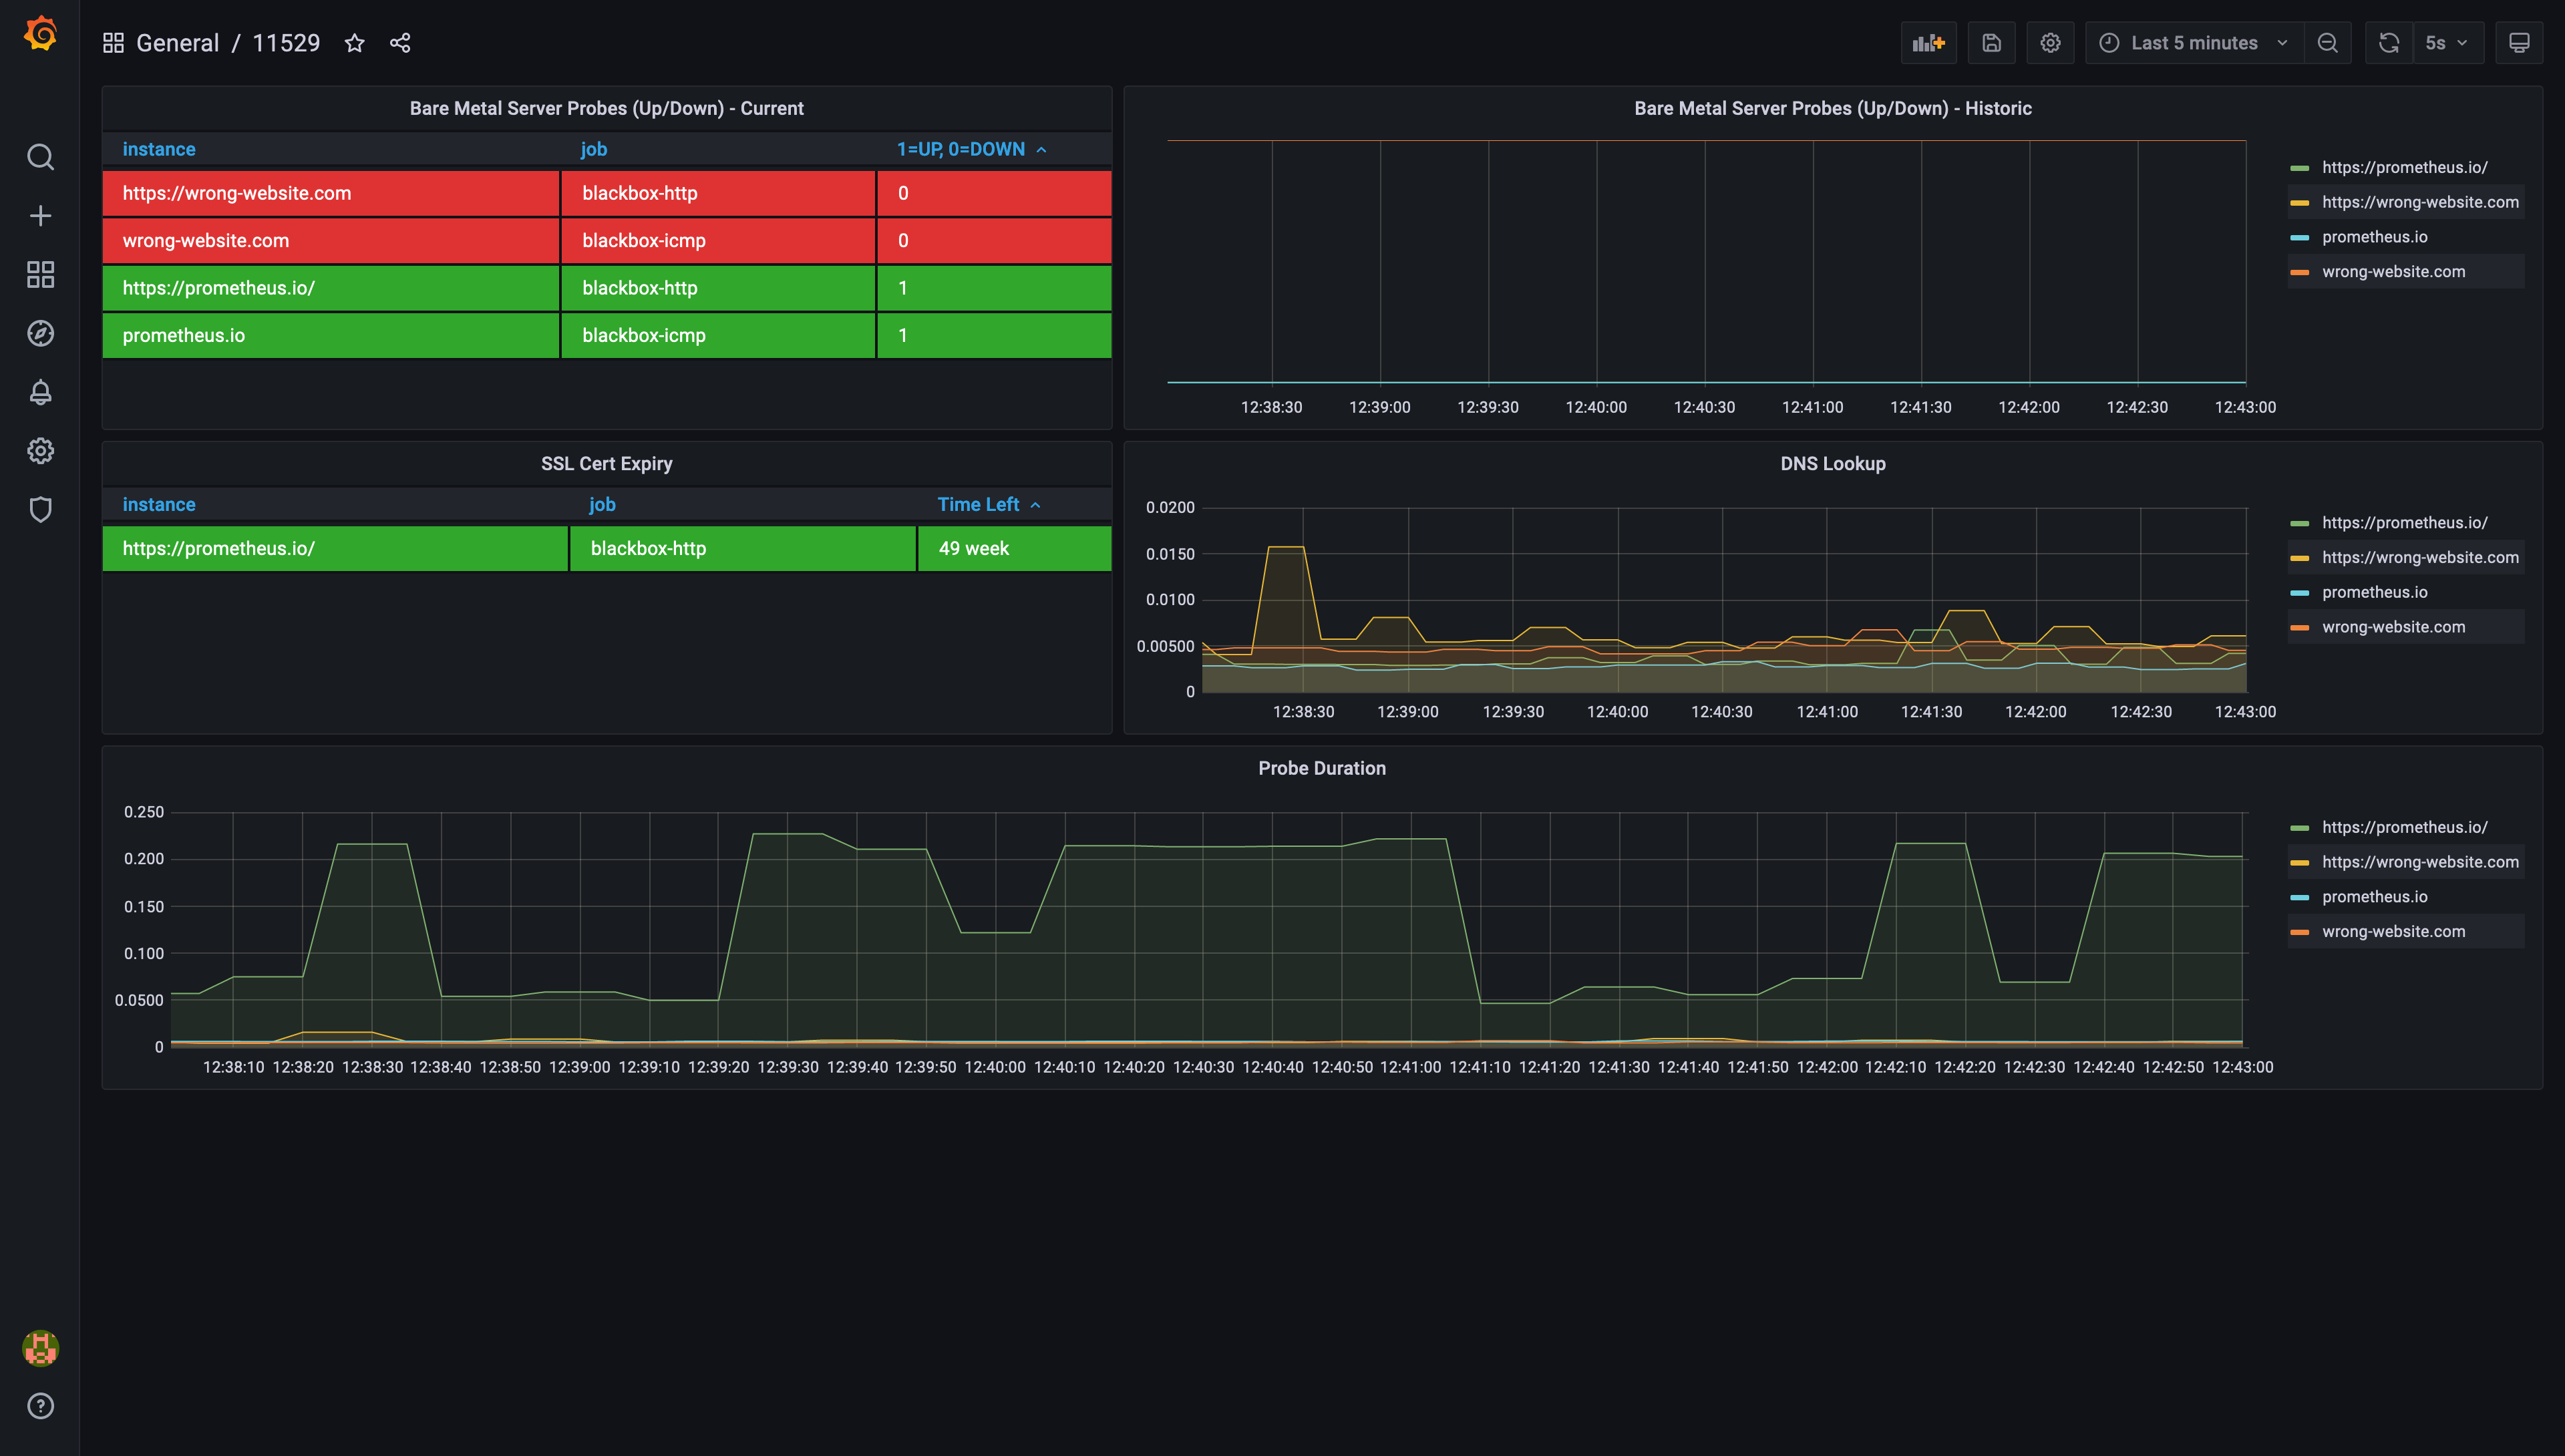 Example of pre-configured dashboard ID 11529
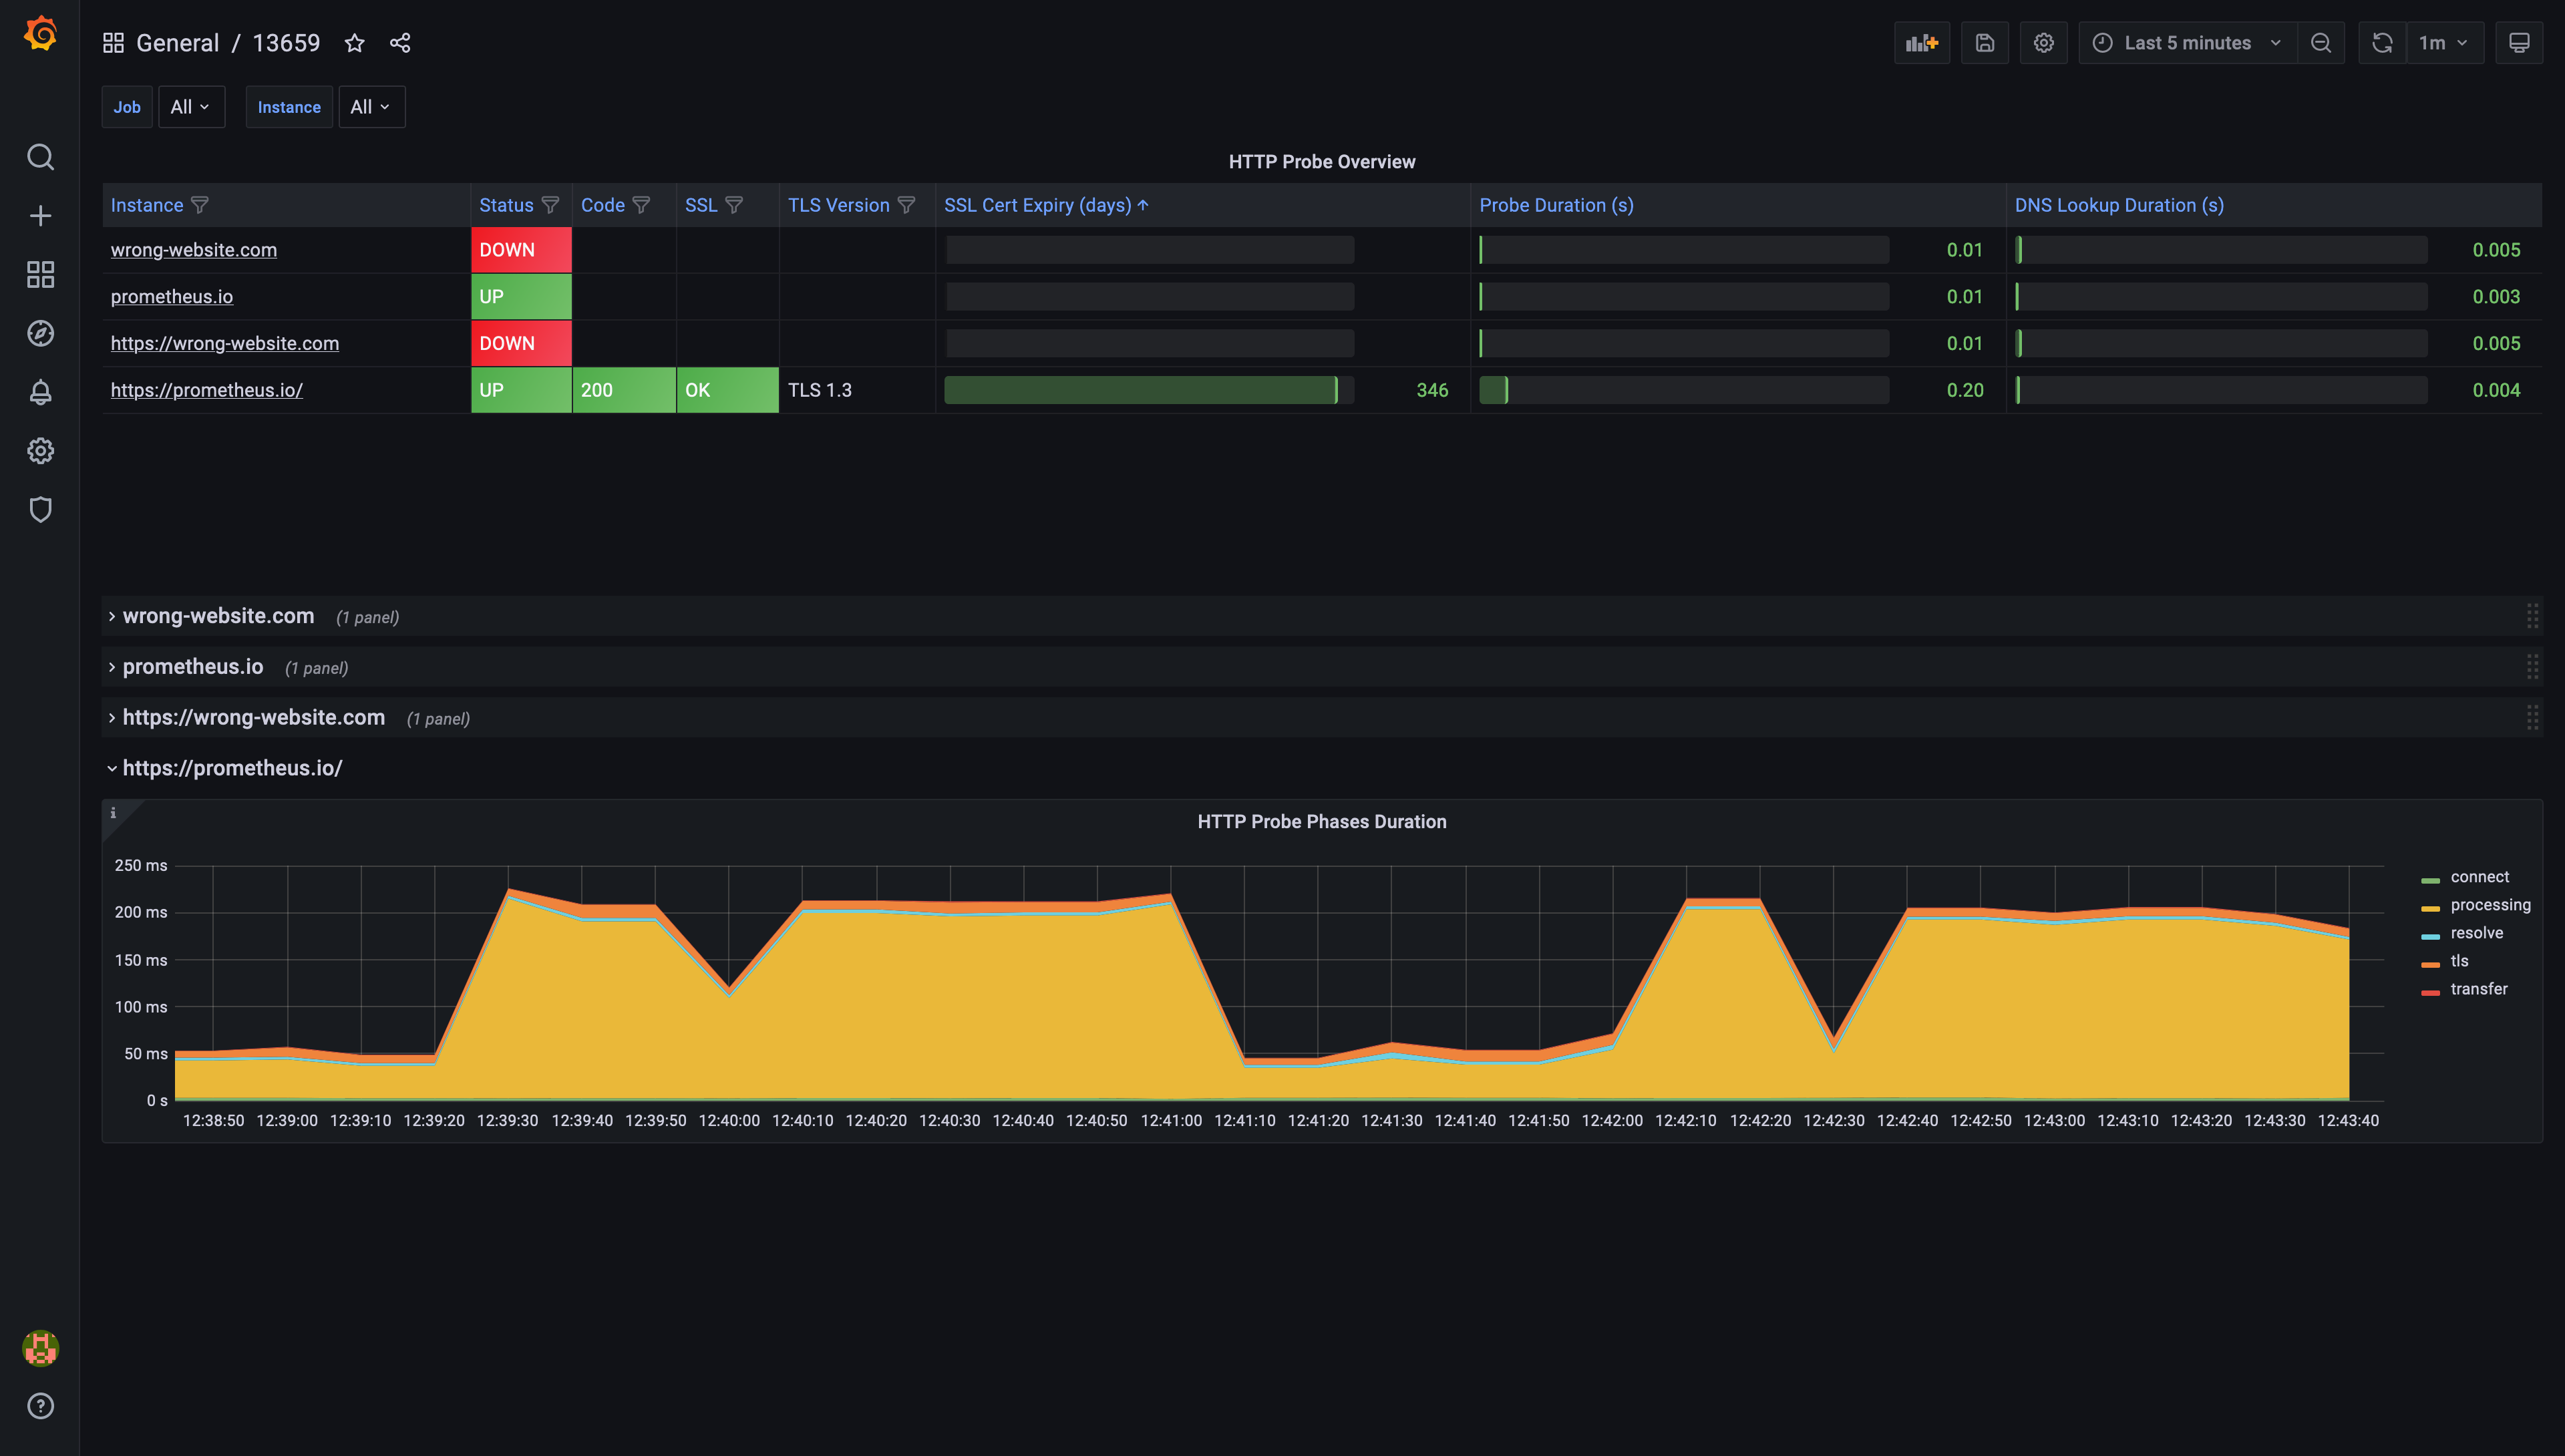 Example of pre-configured dashboard ID 13659