 Grafana: Adding a Blackbox Exporter dashboard
This documentation is part of the Using Prometheus guide. View the full guide here: How to configure Grafana to use Prometheus as a data source.
👋 Welcome to the Stackhero documentation!
Stackhero offers a ready-to-use Grafana cloud solution that provides a host of benefits, including:
- Unlimited users, dashboards, and alerts.
- Unlimited and dedicated SMTP email server included.
- Plugins installable in one click.
- Seamless SSO support, compatible with
GitLab,GitHub,OAuth2protocols.- Effortless updates with just a click.
- Customizable domain name secured with HTTPS (for example, https://grafana.your-company.com).
- Optimal performance and robust security powered by a private and dedicated VM.
Save time and simplify your life: it only takes 5 minutes to try Stackhero's Grafana cloud hosting solution!
Grafana supports pre-configured dashboards for the Blackbox Exporter. To add one:
- In the Grafana UI, go to
Create>Import. - Enter one of the following IDs:
7587,11175,11529, or13659, and clickLoad. - Select your Prometheus data source and click
Import.
This process adds a dashboard designed for Blackbox Exporter data visualization. Use the Job selector at the top left to focus on specific instances.
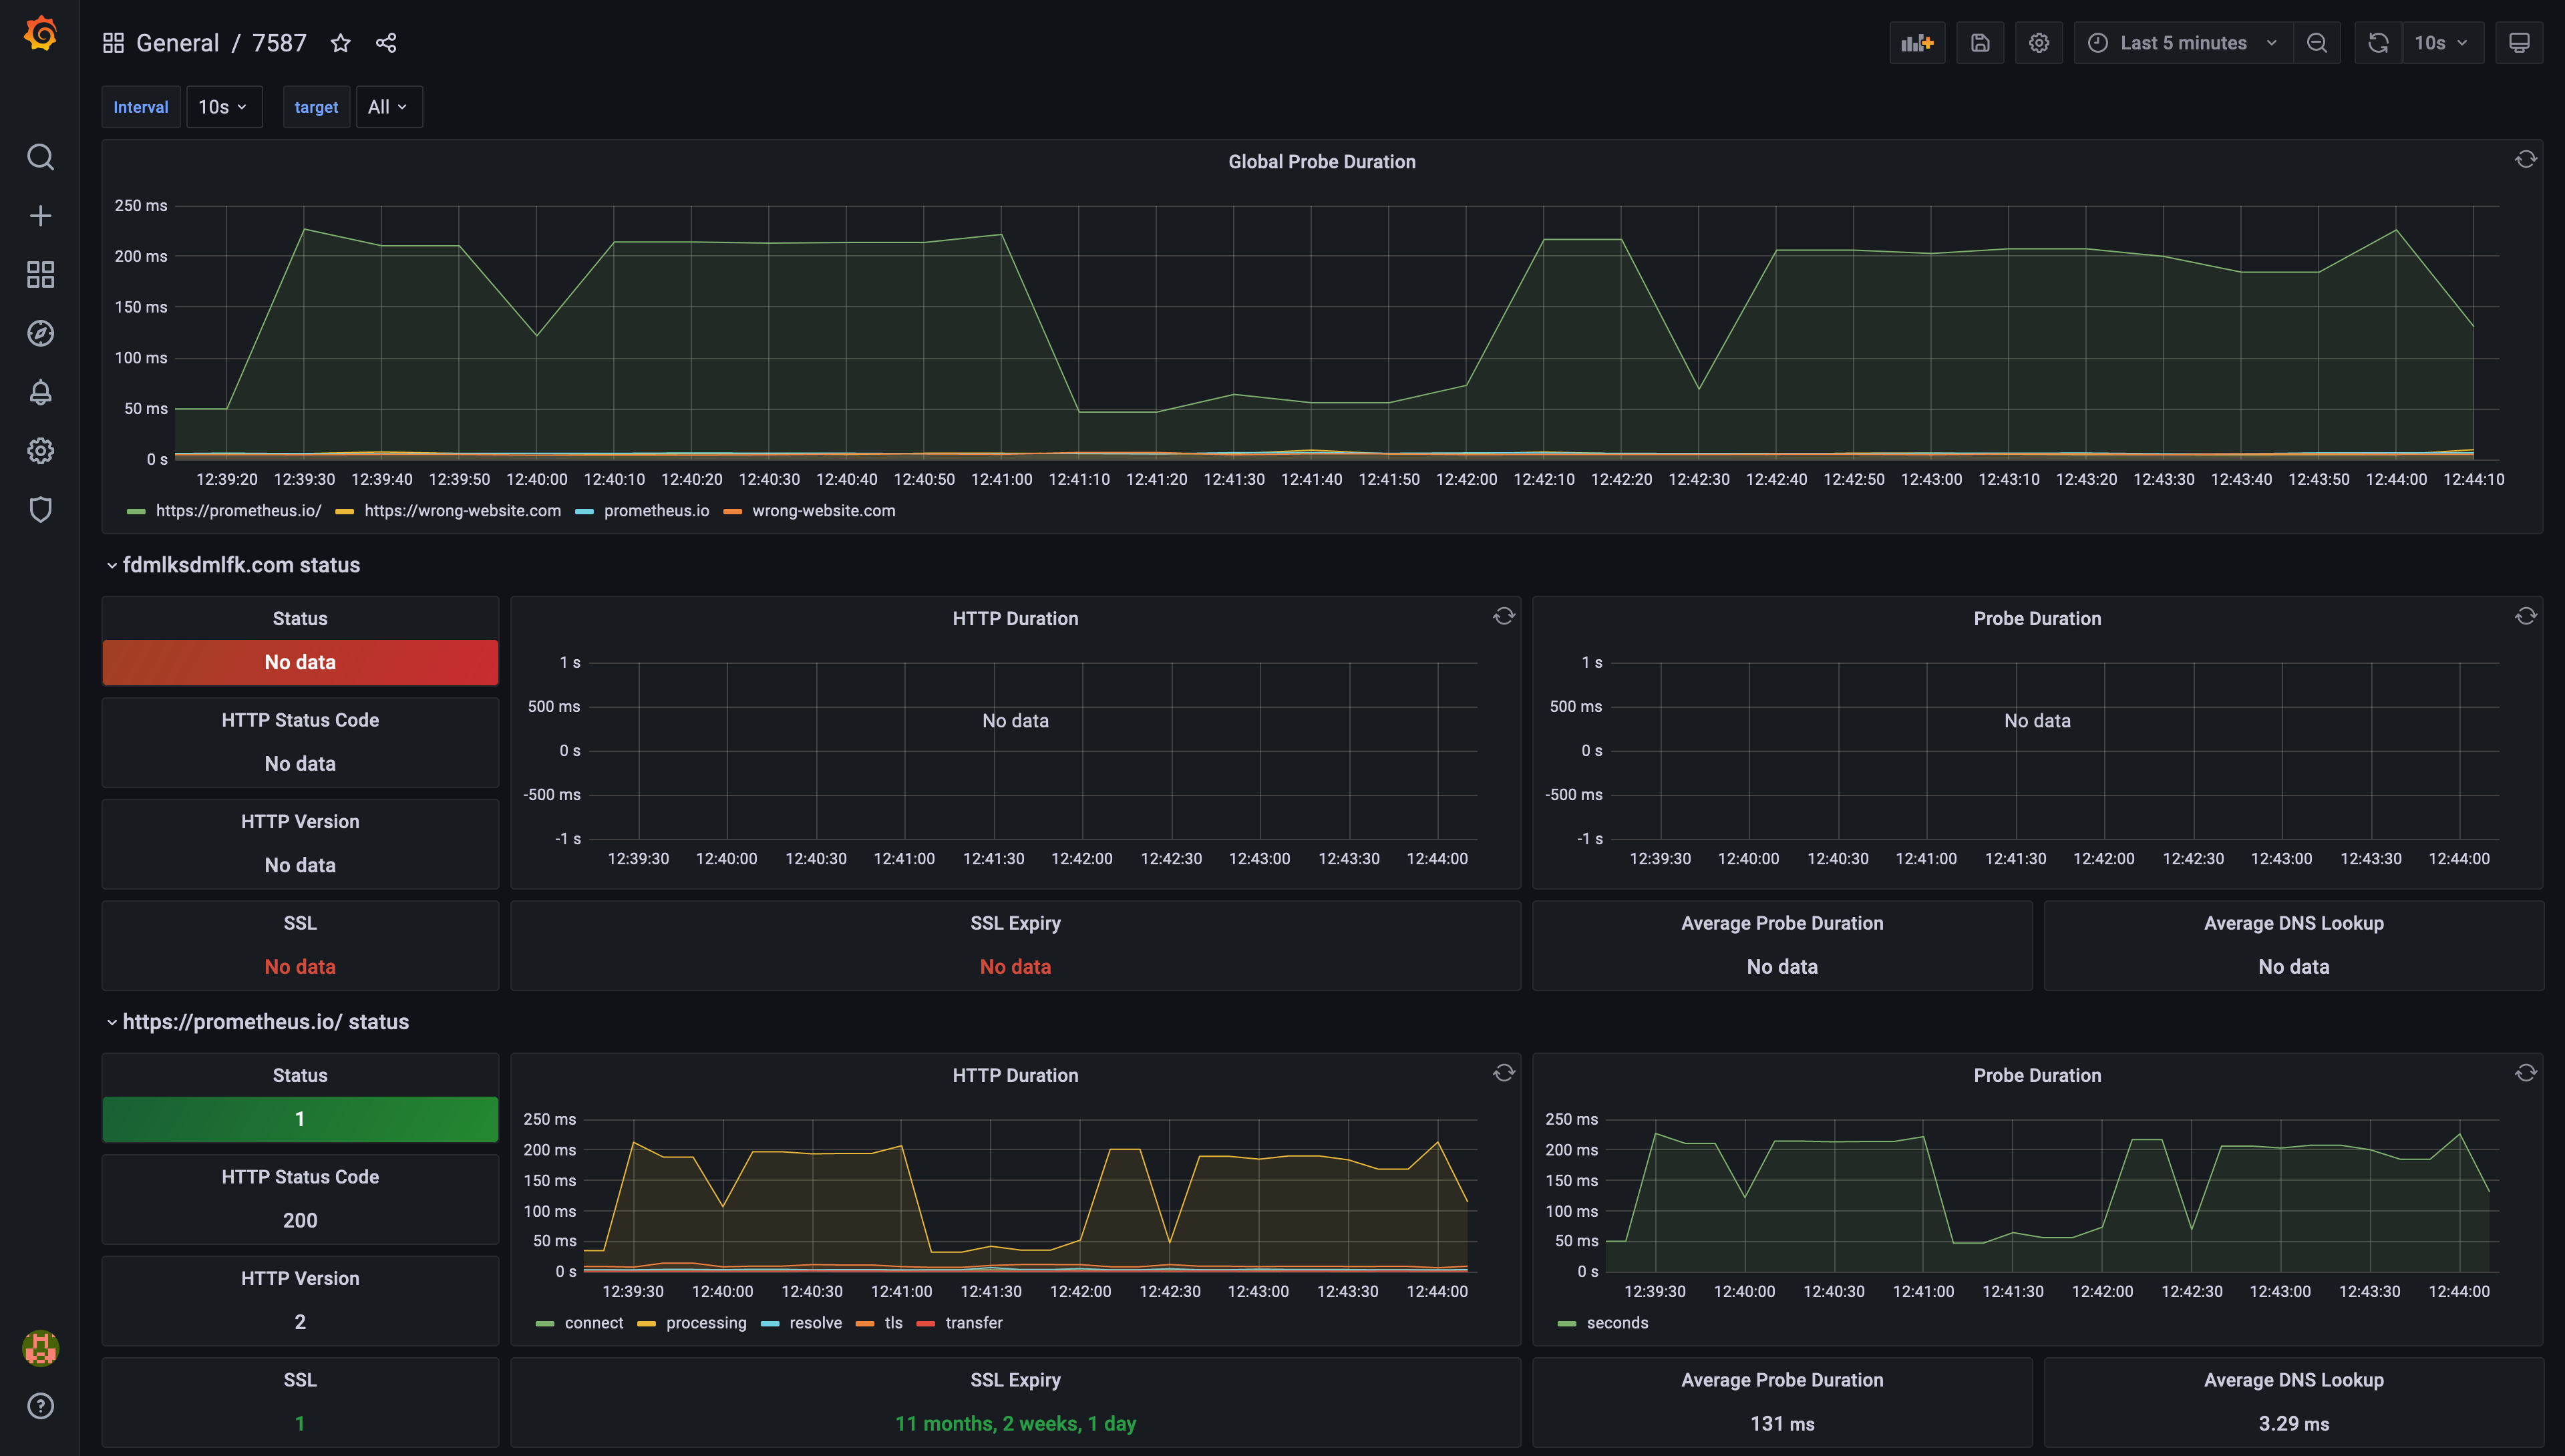 Example of pre-configured dashboard ID 7587
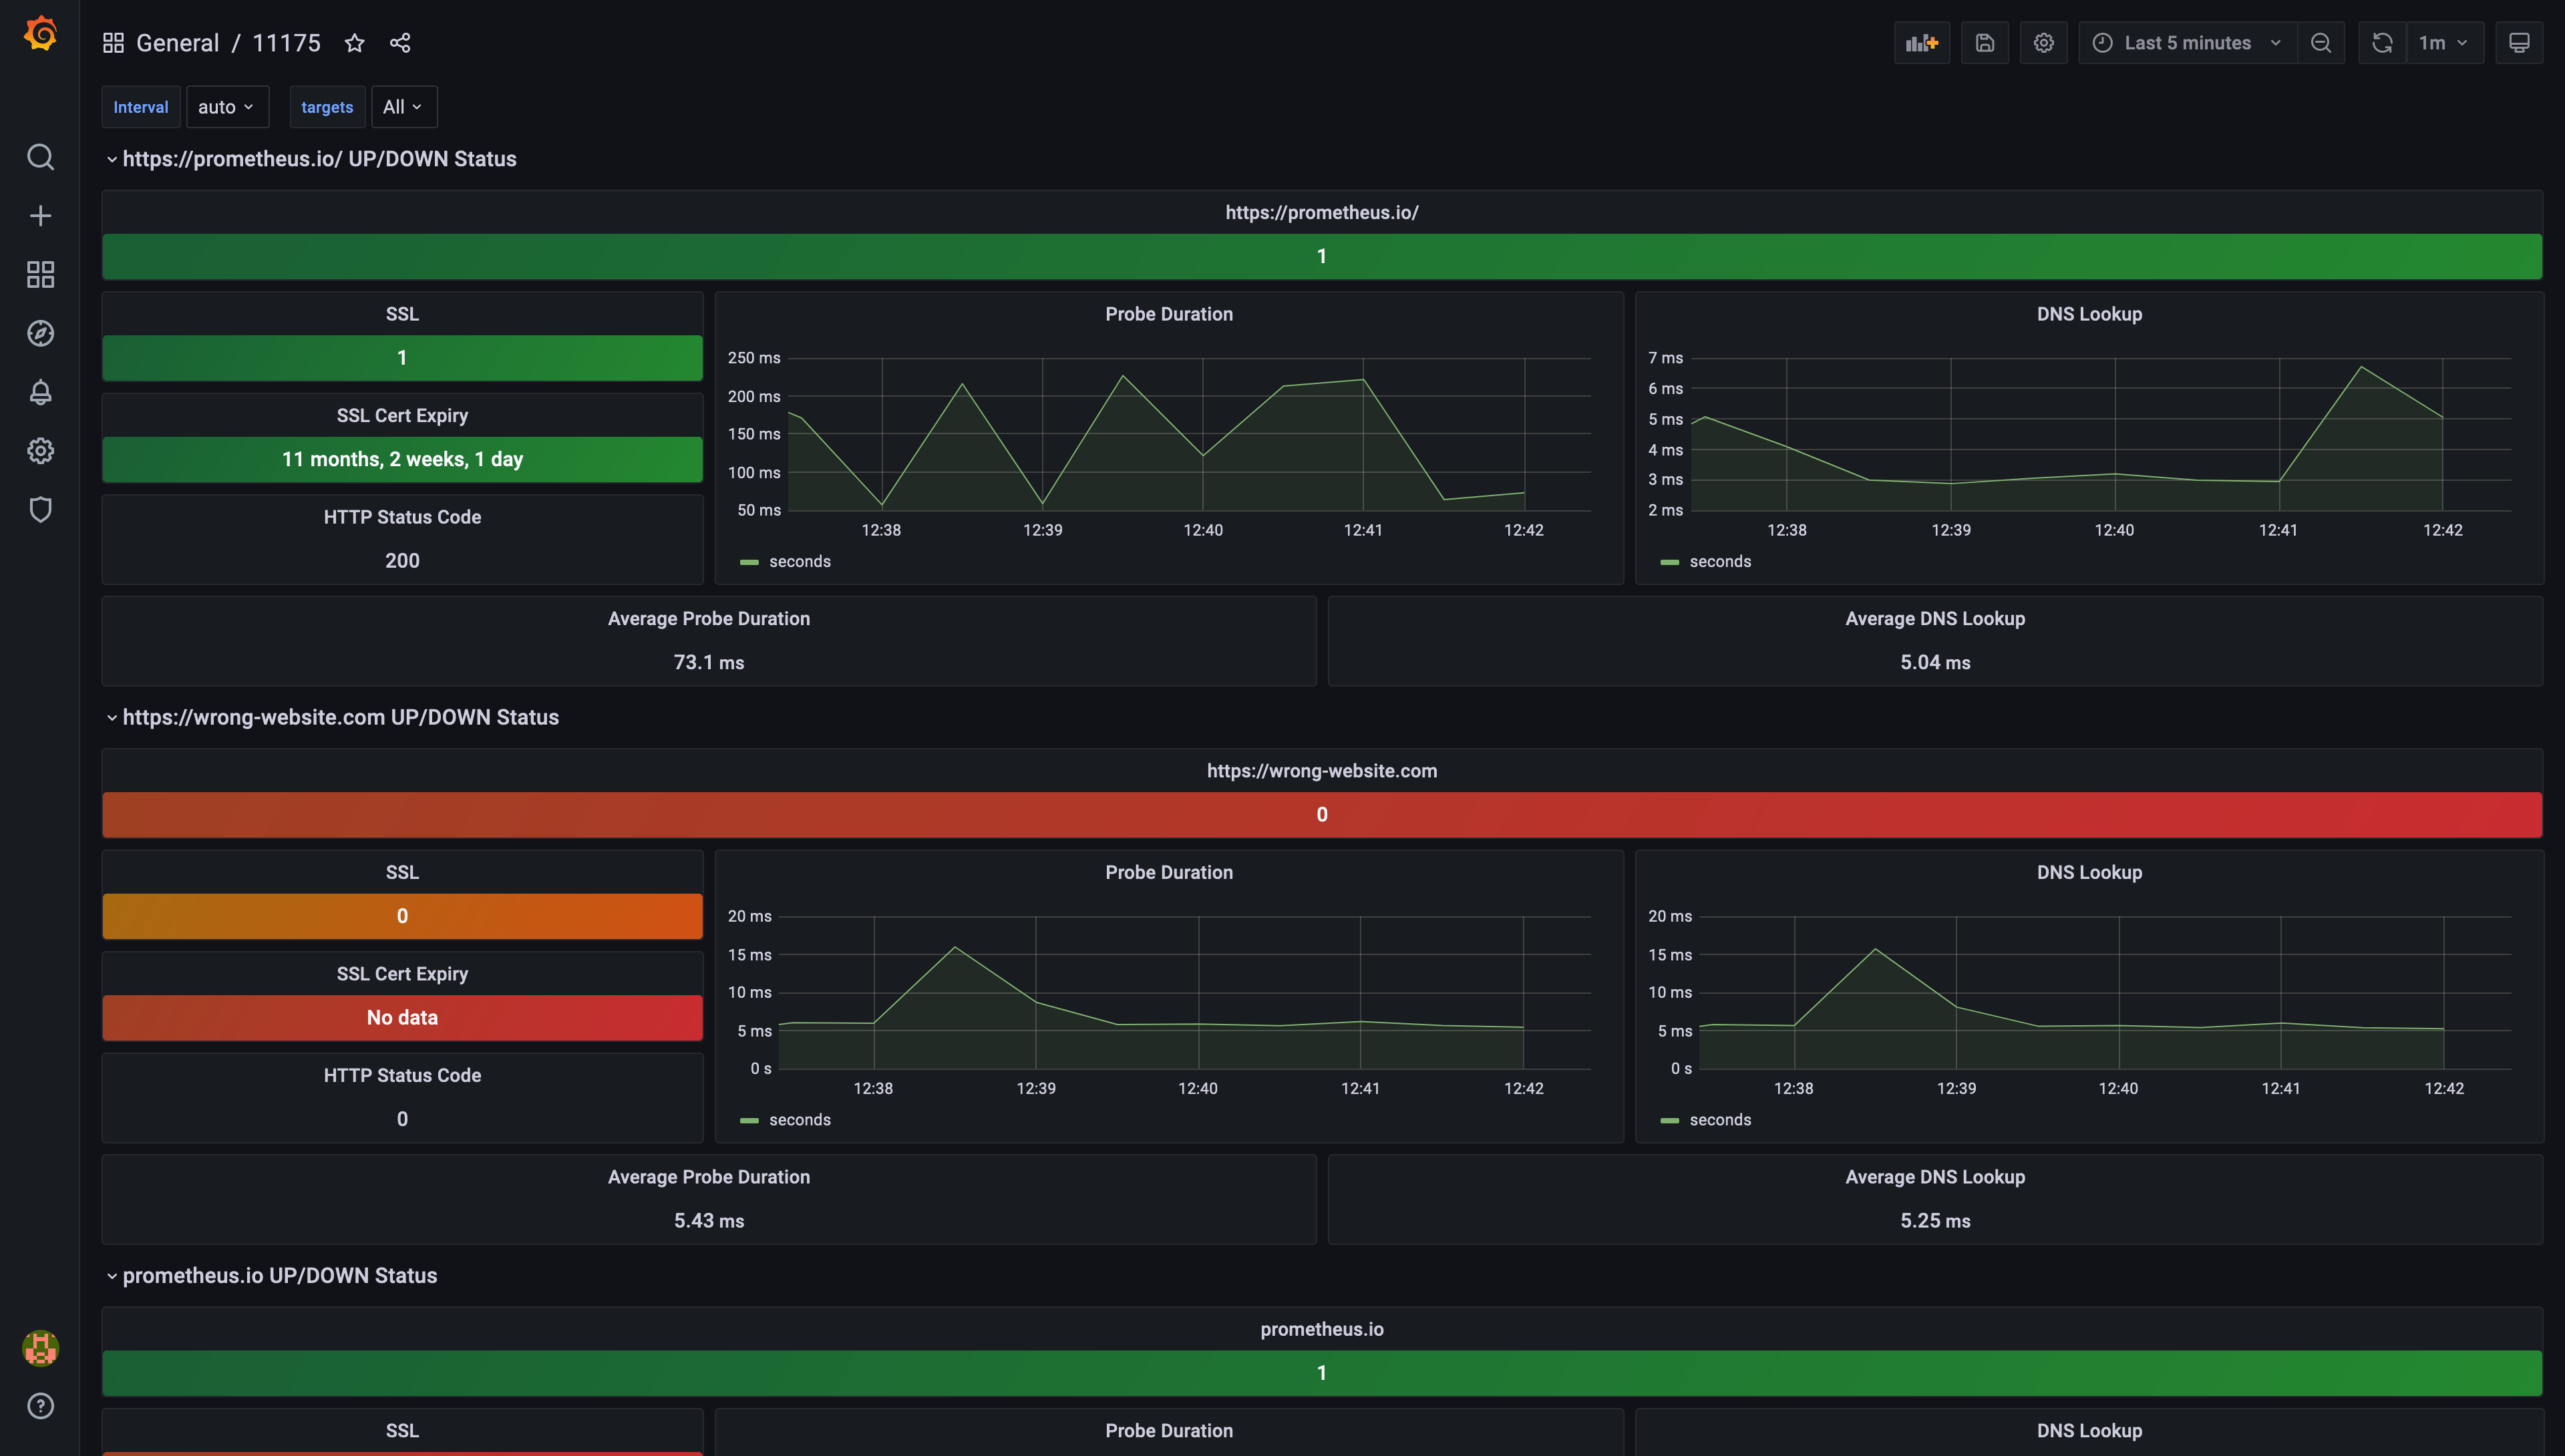 Example of pre-configured dashboard ID 11175
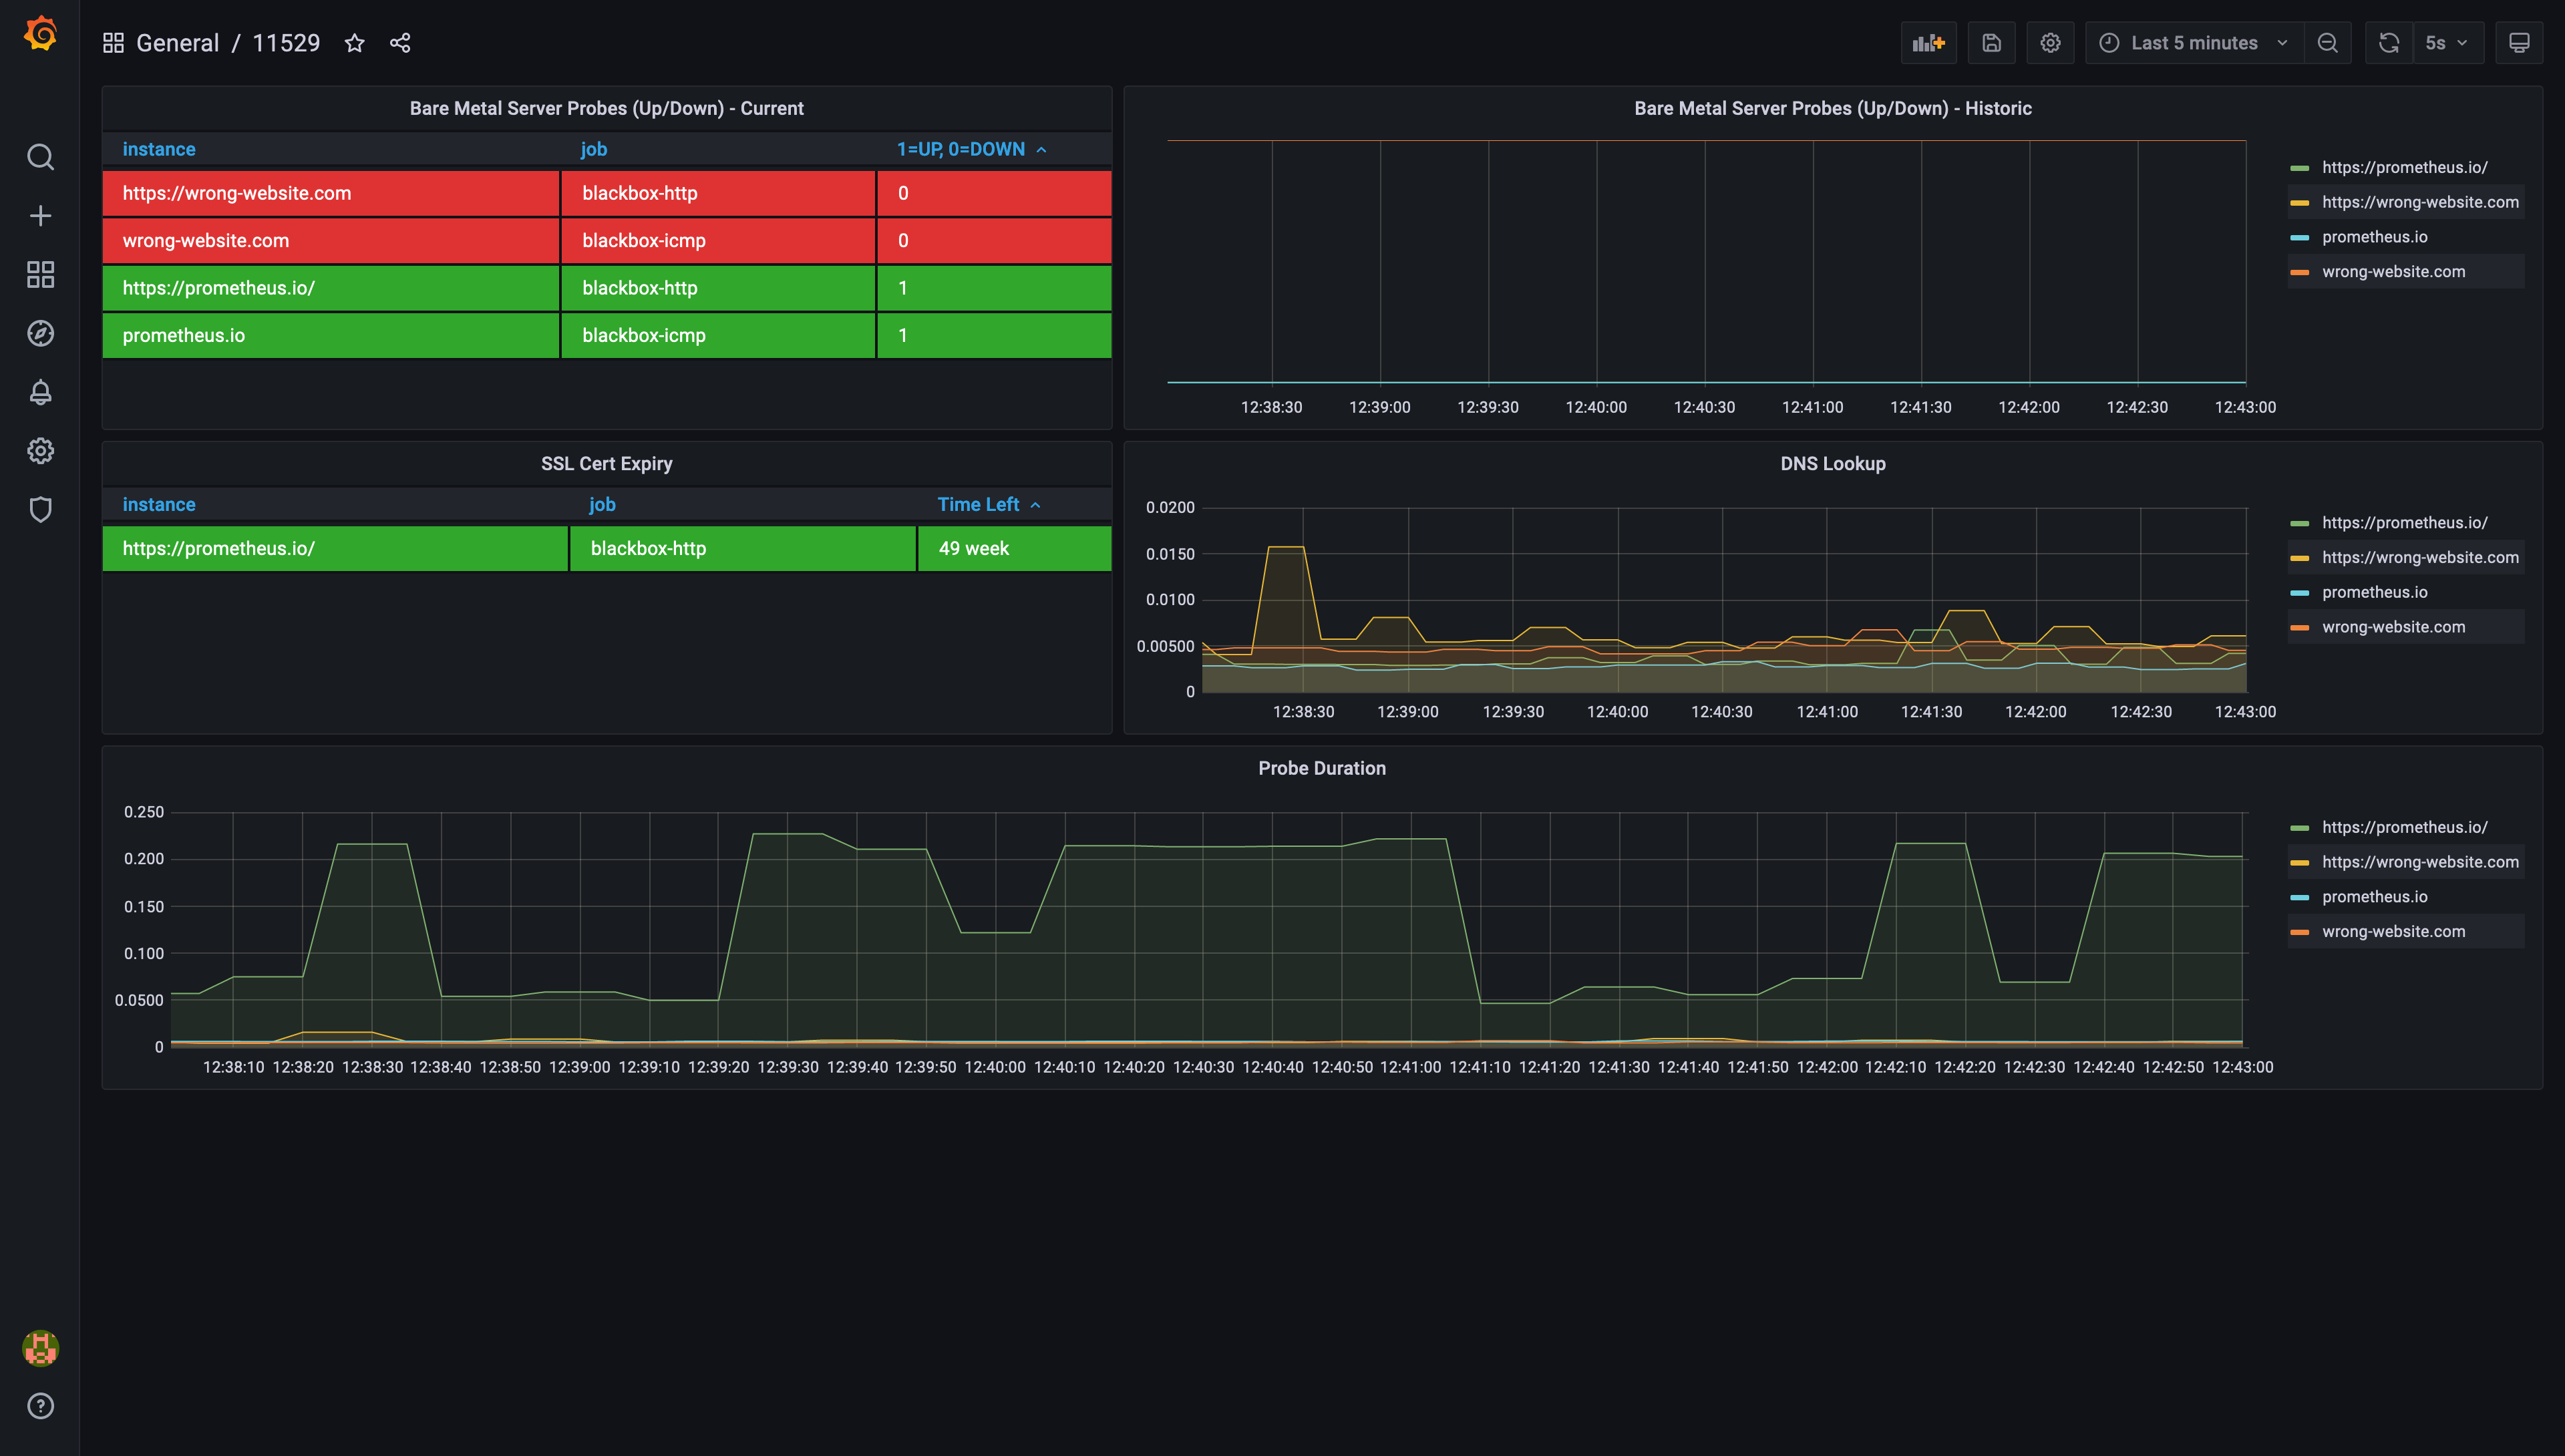 Example of pre-configured dashboard ID 11529
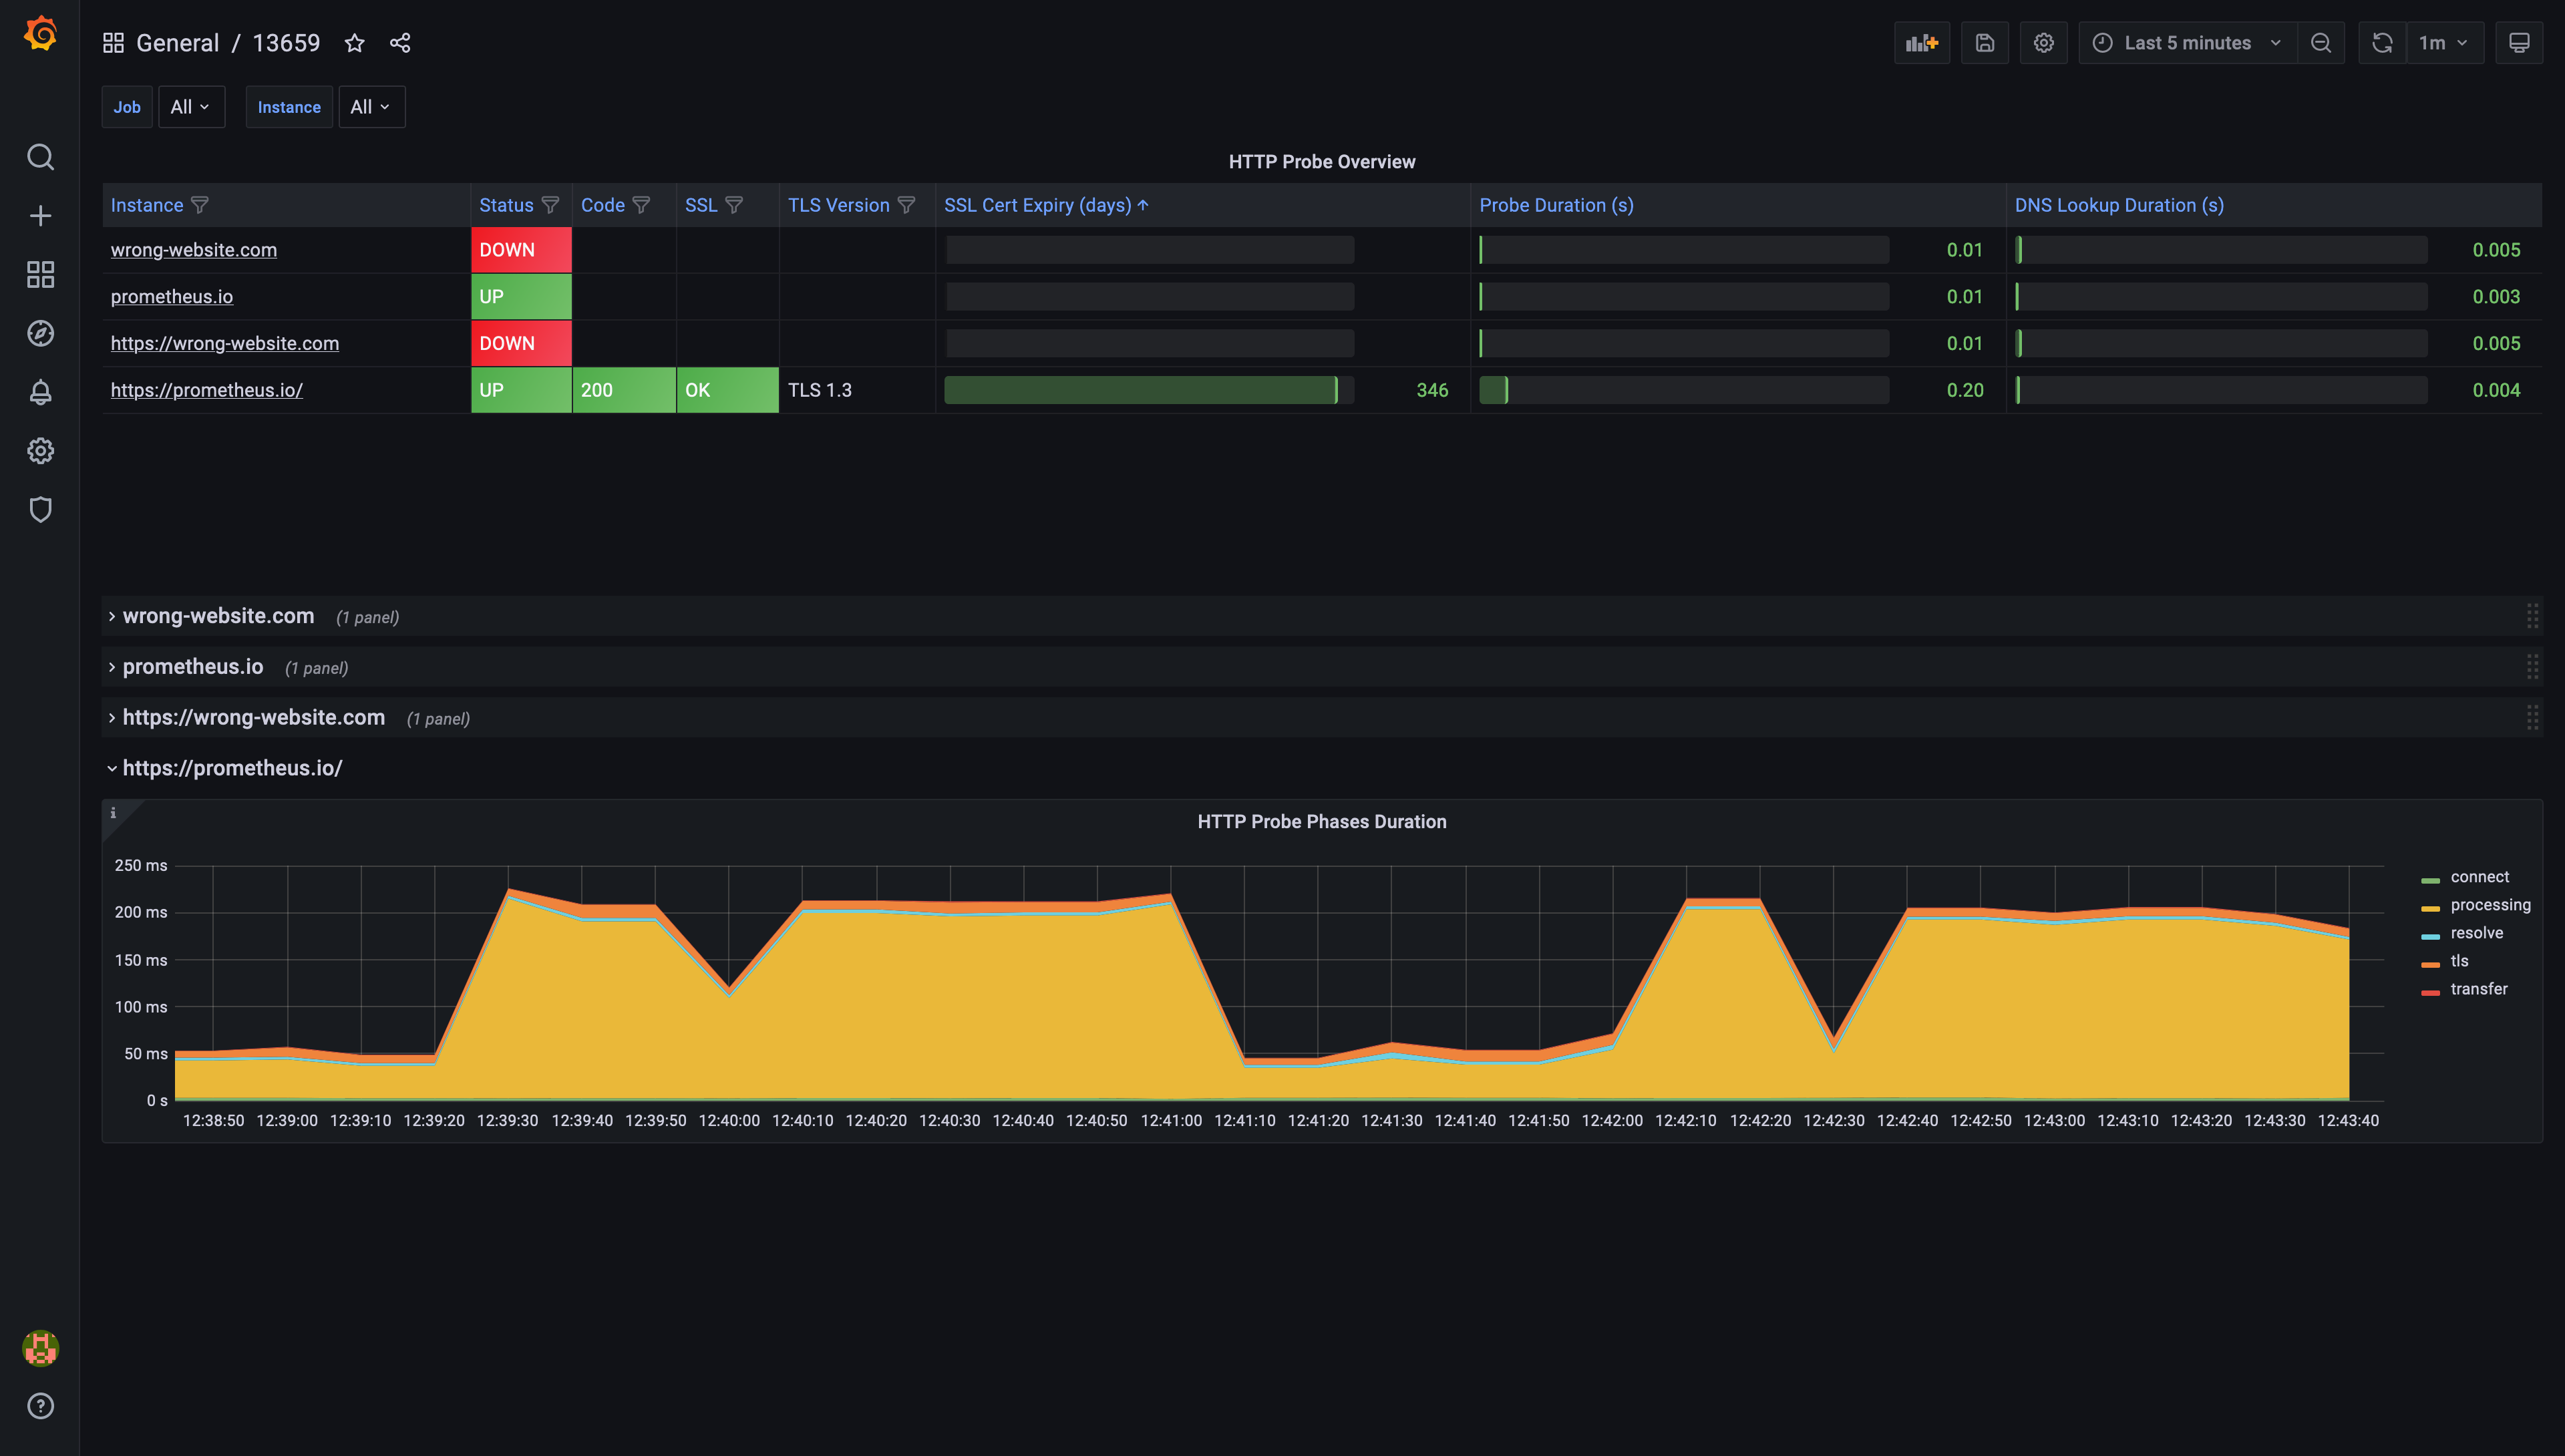 Example of pre-configured dashboard ID 13659