 Grafana: Troubleshooting missing data points in Grafana charts
This documentation is part of the Using Prometheus guide. View the full guide here: How to configure Grafana to use Prometheus as a data source.
👋 Welcome to the Stackhero documentation!
Stackhero gives you a ready-to-use Grafana cloud environment built for quick setup and reliable performance:
- Unlimited users, dashboards, and alerts: scale your monitoring as needed, without artificial limits.
- Dedicated SMTP email server included, so you can send all the notifications you want, with no quotas to track.
- One-click plugin installation streamlines adding new features to Grafana.
- Built-in SSO support for
GitLab,GitHub,OAuth2provider. User management stays simple and secure.- One-click updates keep your Grafana instance current, with no downtime or maintenance hassle.
- Use your own custom domain with automated HTTPS provisioning for secure, branded access (for example, https://grafana.your-company.com).
- High performance and strong security are standard, running on your own private, dedicated infrastructure.
Get started faster and save setup time: a secure Grafana cloud hosting instance is ready in about 5 minutes.
Are you noticing gaps in your Grafana charts? A common cause is a mismatch in scrape intervals between Prometheus and Grafana. Here is how you can address this:
- Open your Prometheus configuration file and check the
global/scrape_intervalsetting. For Stackhero's Prometheus instance, the default is typically15s.
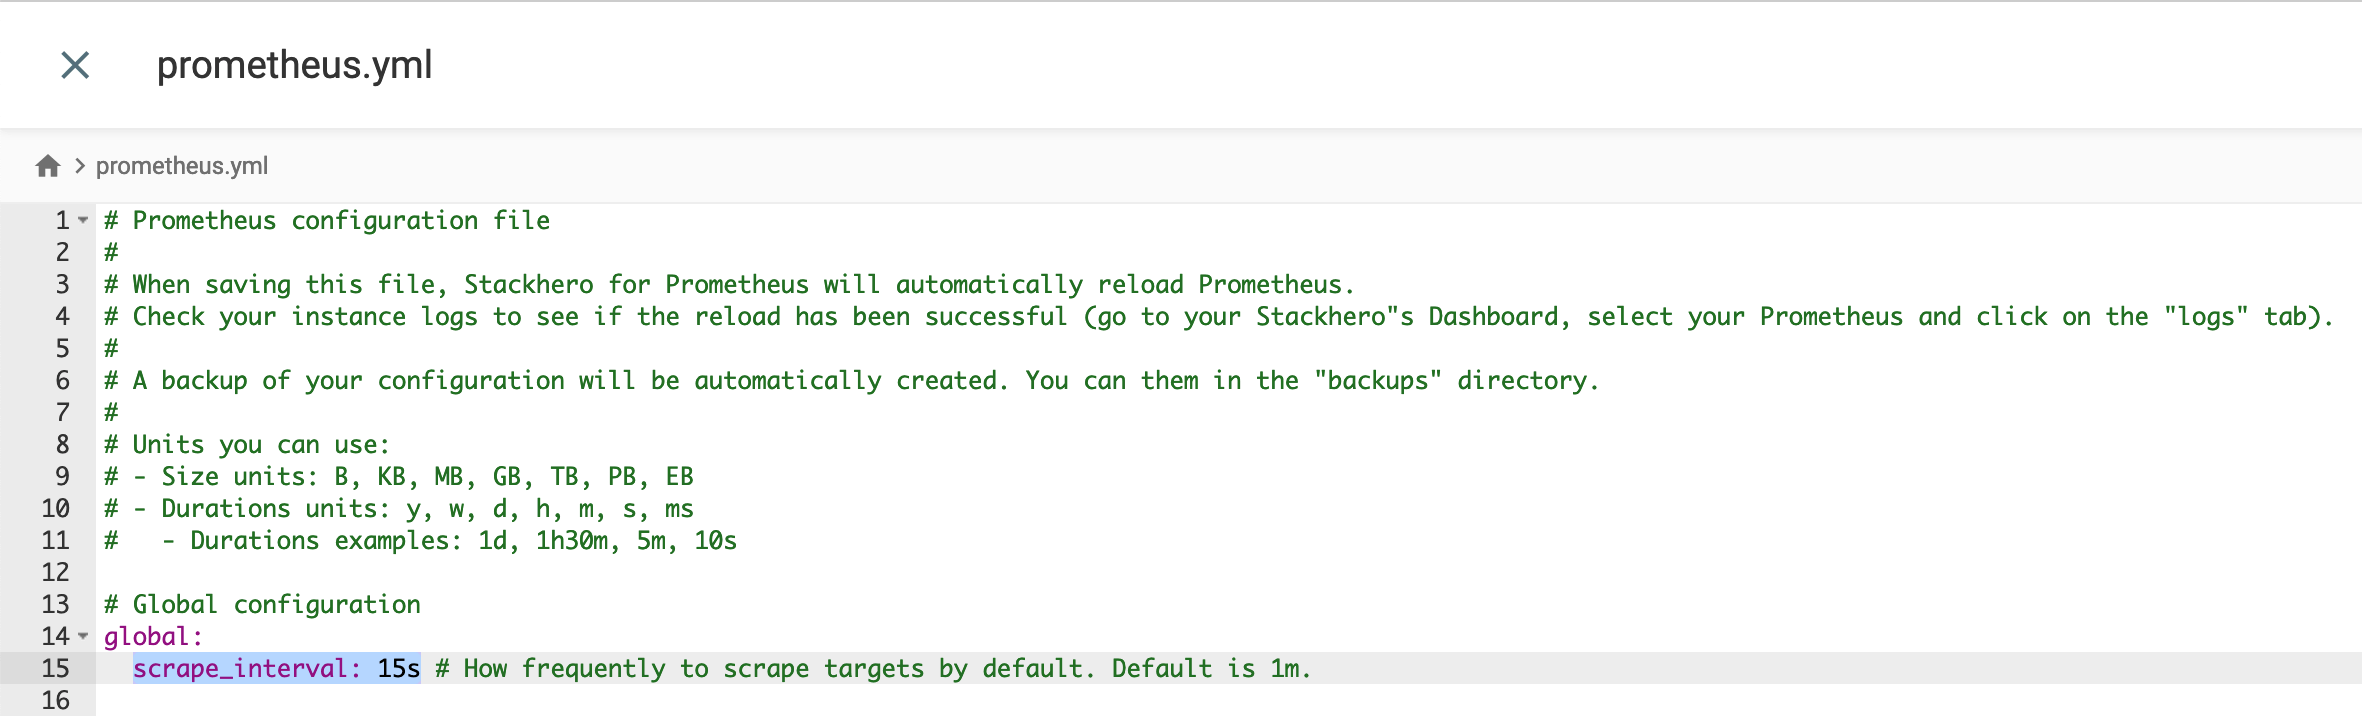 Prometheus default configuration
- In the Grafana UI, navigate to
Configuration>Data Sourcesand selectPrometheus. - Ensure the
Scrape Intervalin Grafana matches thescrape_intervalin your Prometheus configuration.
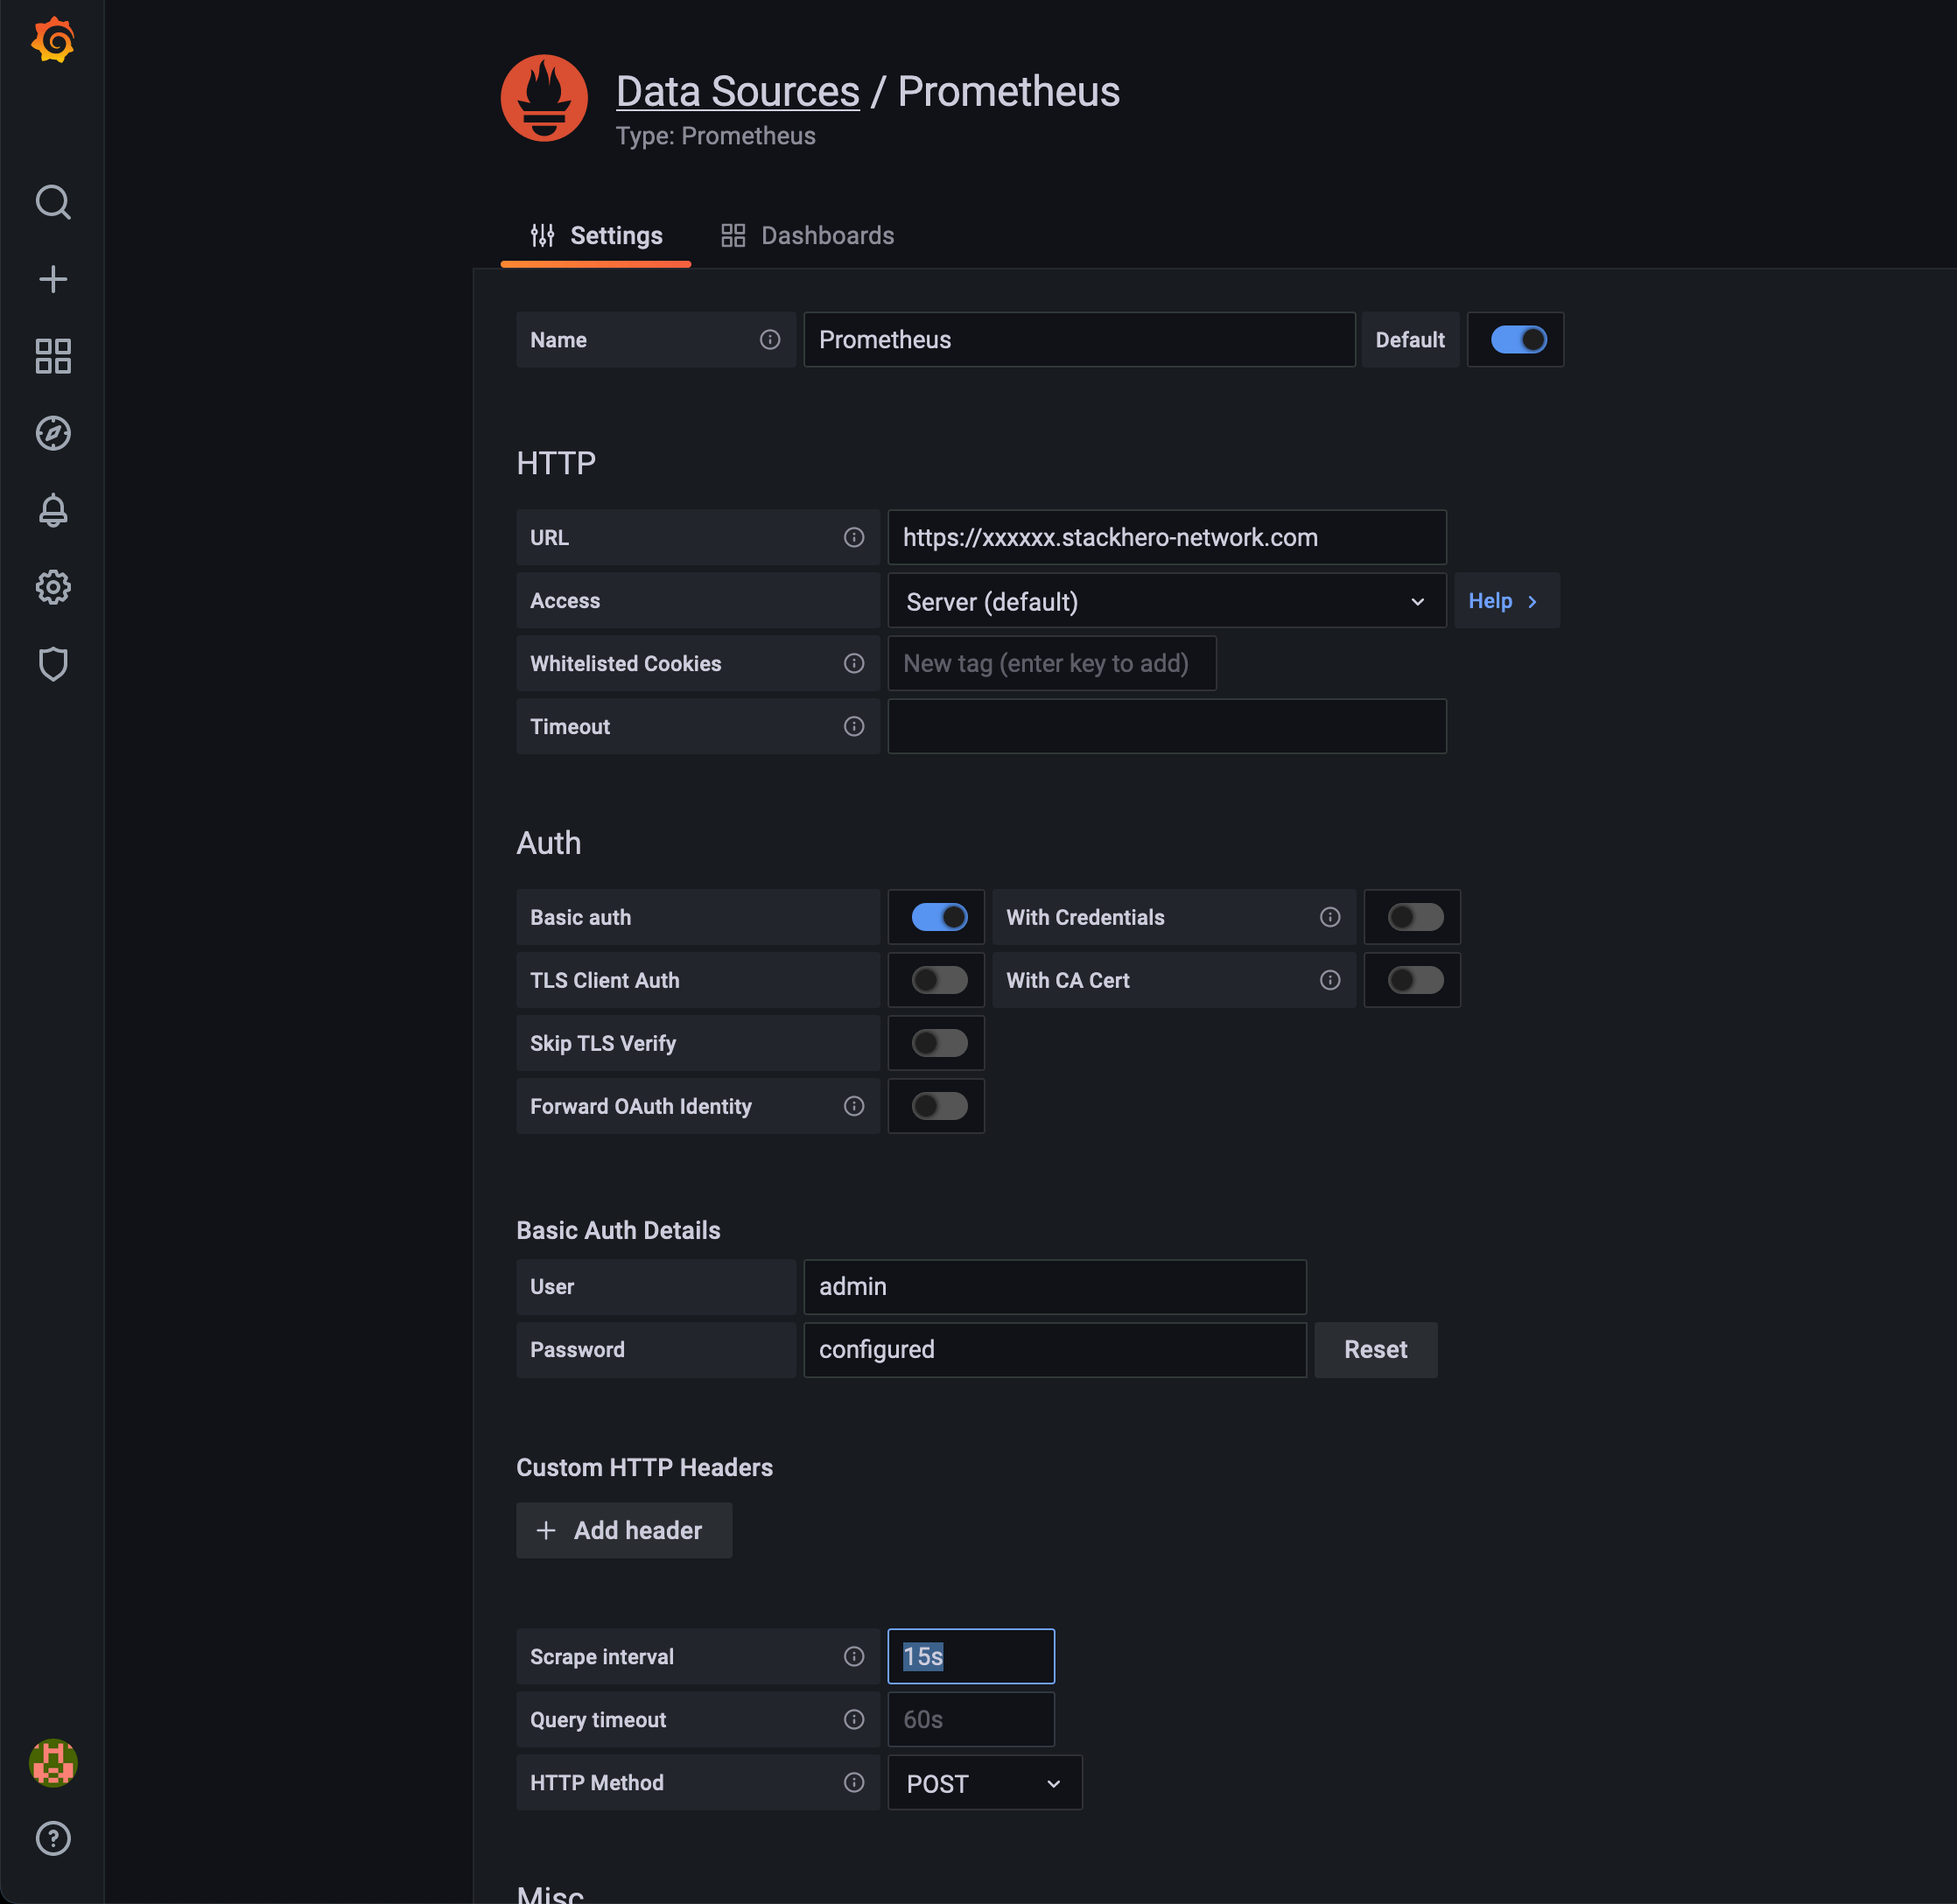 Prometheus data source configuration in Grafana
By aligning the scrape intervals, you can resolve most issues related to missing data points in your dashboards.