 Prometheus: Introduction
How Prometheus works
👋 Welcome to the Stackhero documentation!
Stackhero delivers a fully managed Prometheus cloud platform designed for reliability and simplicity:
Alert Manageris built in, so you can route alerts directly toSlack,Mattermost,PagerDuty, and other popular destinations.- A dedicated email server lets you send unlimited email alerts without extra setup.
Blackboxis included, allowing you to probeHTTP,ICMP,TCP, and other protocols for comprehensive monitoring.- Configure your instance quickly using the online configuration file editor. There is no need to manage YAML by hand.
- Apply updates with a single click. Stackhero handles the upgrade process for you, minimizing downtime and manual intervention.
- High performance and strong security are built in, thanks to your own private, dedicated infrastructure.
Get up and running in about 5 minutes. Stackhero takes care of the setup so you can focus on monitoring, not maintenance. Try Prometheus cloud hosting on Stackhero to streamline your monitoring and alerting workflows.
What is Prometheus
Prometheus is a highly adaptable and dependable monitoring system designed to bolster the performance and reliability of various infrastructures. It integrates effortlessly with different environments, including physical servers, virtual machines, and networking hardware. Prometheus collects and processes metrics from predefined targets, enabling the generation of alerts based on specific conditions to keep you informed about your system's status.
The Alert Manager, included in your Stackhero Prometheus instance, facilitates the setup of notification alerts. These alerts can be configured to work with widely-used communication tools like email, Slack, PagerDuty, OpsGenie, and others. When integrated with Grafana, Prometheus evolves into a comprehensive monitoring suite, offering interactive dashboards for effective metric visualization and analysis.
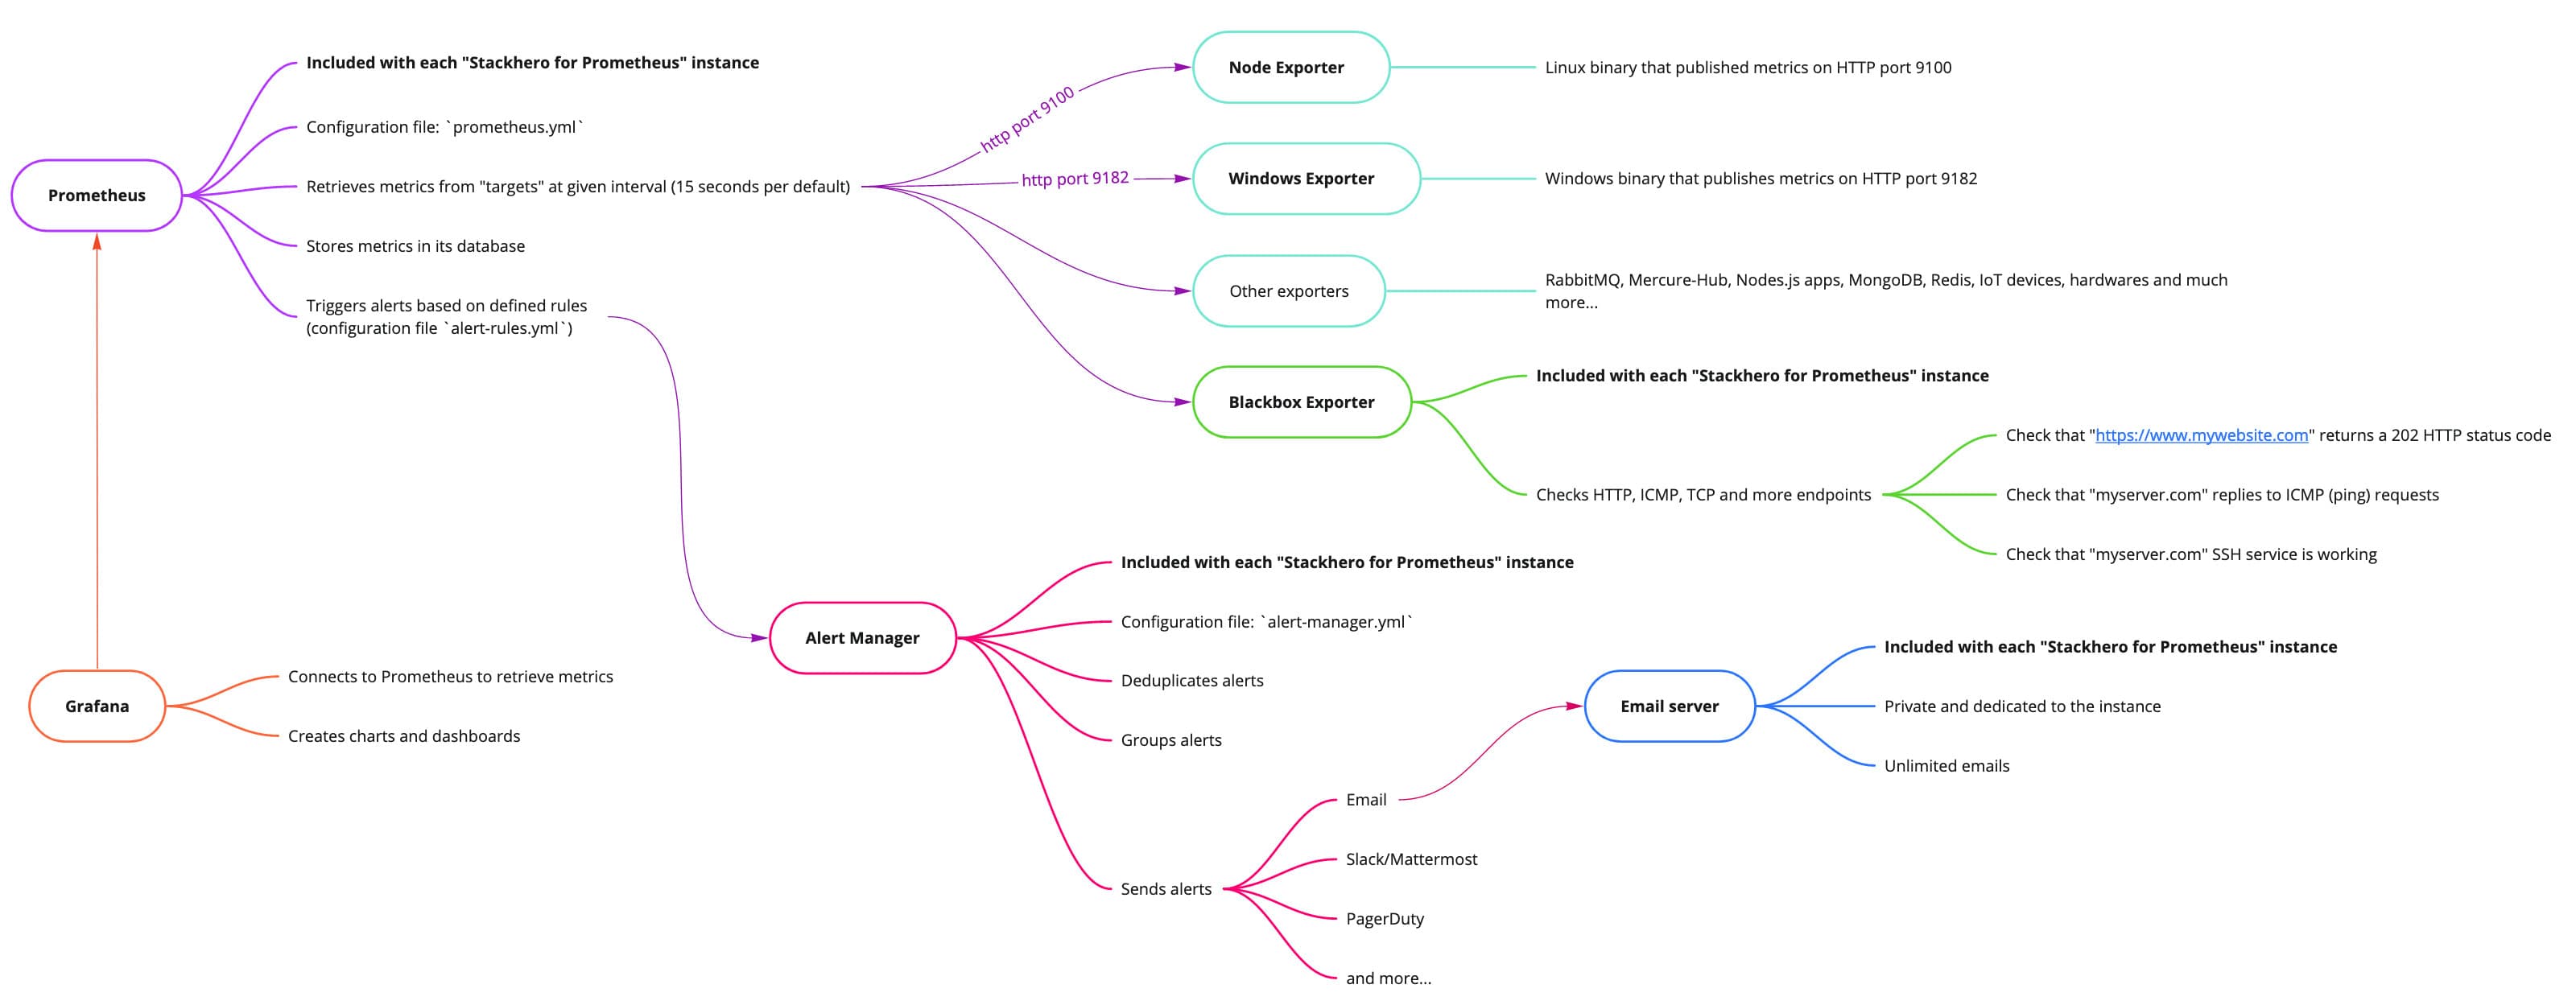 Overview of Stackhero for Prometheus
Overview of Prometheus services
Prometheus provides monitoring capabilities through essential and supplementary components. Below are the key elements:
-
Prometheus Server:
- Periodically collects metrics from specified
targets(exporters) via HTTP. - Stores these metrics in its built-in time-series database.
- Evaluates alerting rules to generate notifications based on thresholds.
- Periodically collects metrics from specified
-
Alert Manager:
- Manages alerts generated by Prometheus.
- Aggregates, deduplicates, and forwards these alerts to your preferred communication channels.
-
Blackbox Exporter:
- Tests the availability and performance of endpoints using protocols such as HTTP(S), DNS, TCP, and ICMP.
-
Node Exporter:
- Provides hardware and OS-level metrics for Linux servers to Prometheus.
-
Grafana:
- A visualization platform that complements Prometheus, enabling the creation of dynamic, customizable dashboards for detailed data analysis.
Configuring Prometheus, Alert Manager, and Blackbox
You can manage the configurations for Prometheus, Alert Manager, and Blackbox using YAML configuration files. These files are accessible and editable directly from your Stackhero dashboard. After you make changes, they are applied automatically, ensuring a seamless configuration process without requiring service restarts.
If an error exists in a configuration file, the changes will not be applied. To troubleshoot, you can review the error logs available in the "logs" section of your Prometheus service on the Stackhero dashboard.
Backups of Prometheus configurations
Each time you modify a configuration file, a backup is automatically created and stored in a designated backups directory. The system retains the five most recent backups or those created within the past 14 days, automatically removing older entries.
You can access these backups at the following URL: https://<yourServiceDomain>/configurations/files/backups/.
Deleting data from Prometheus
If you need to remove specific time-series data recorded in Prometheus, you can utilize the admin API. For example, to delete data associated with a job named oldJob, you could use the following command:
curl -u admin -X POST -g 'https://<yourServiceDomain>/api/v1/admin/tsdb/delete_series?match[]={job="oldJob"}'
Once data is deleted, it cannot be recovered. Ensure you have comprehensive backups and proceed cautiously when performing such actions.
For additional information, refer to the official Prometheus documentation.