 Prometheus: Introduction to Prometheus alerts
This documentation is part of the Alerts guide. View the full guide here: How Prometheus alerts work and how to configure them.
👋 Welcome to the Stackhero documentation!
Stackhero delivers a fully managed Prometheus cloud platform designed for reliability and simplicity:
Alert Manageris built in, so you can route alerts directly toSlack,Mattermost,PagerDuty, and other popular destinations.- A dedicated email server lets you send unlimited email alerts without extra setup.
Blackboxis included, allowing you to probeHTTP,ICMP,TCP, and other protocols for comprehensive monitoring.- Configure your instance quickly using the online configuration file editor. There is no need to manage YAML by hand.
- Apply updates with a single click. Stackhero handles the upgrade process for you, minimizing downtime and manual intervention.
- High performance and strong security are built in, thanks to your own private, dedicated infrastructure.
Get up and running in about 5 minutes. Stackhero takes care of the setup so you can focus on monitoring, not maintenance. Try Prometheus cloud hosting on Stackhero to streamline your monitoring and alerting workflows.
Prometheus can analyze your metrics and trigger alerts based on rules that you define. With Stackhero for Prometheus, alerts are processed in two stages. First, Prometheus alert rules are evaluated and then Alert Manager takes over.
Everything is pre-installed and configured with Stackhero for Prometheus so you only need to perform minimal setup, such as adding your email address, to start receiving alerts.
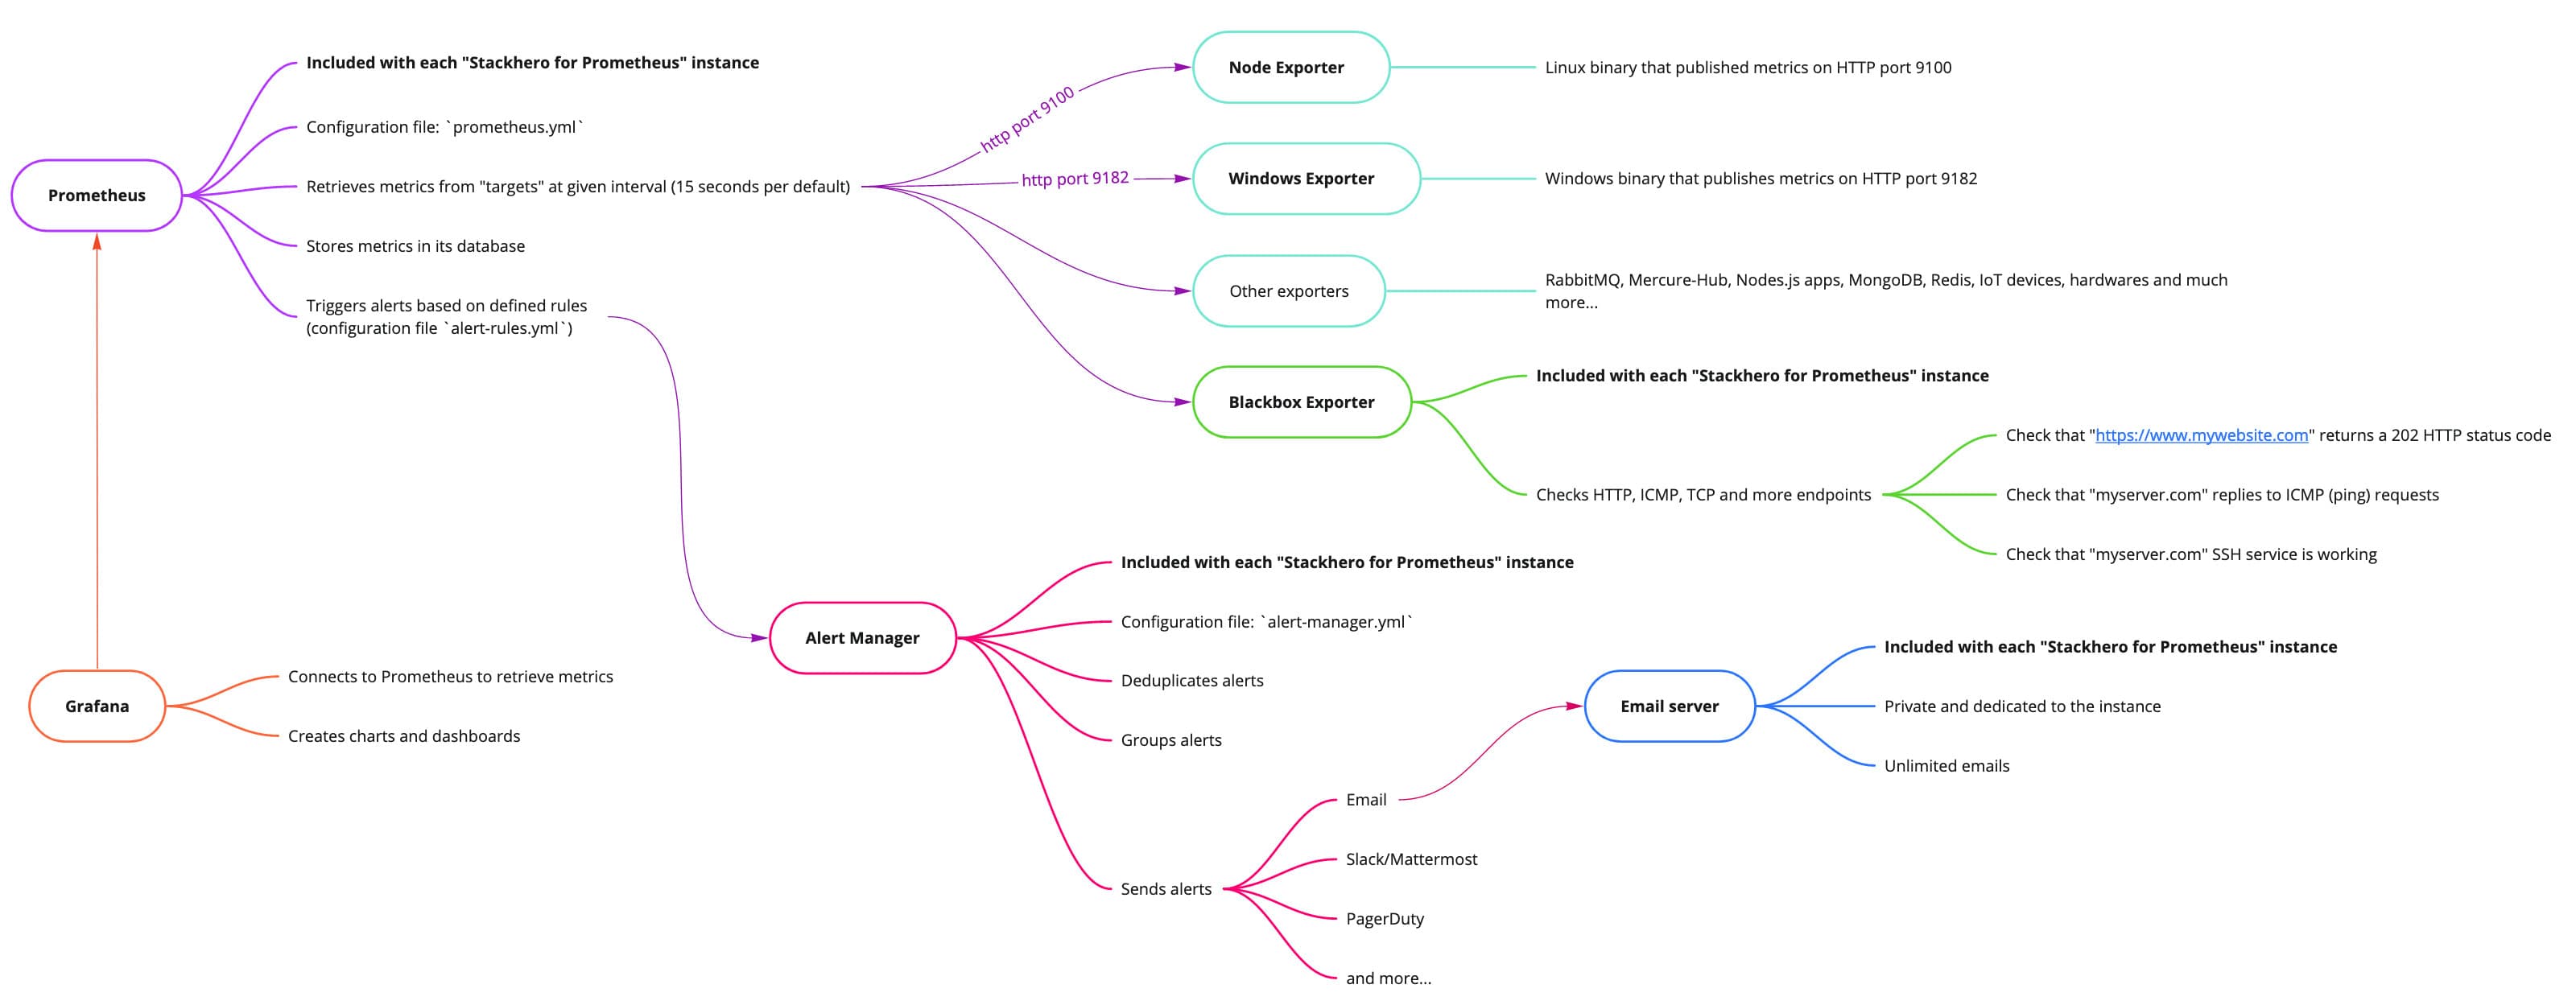 Big picture of Stackhero for Prometheus
Introduction to Prometheus alert rules
When Prometheus retrieves metrics, it evaluates them against rules specified in the rules-alert.yml file. These alert rules define thresholds and time windows for triggering alerts based on the metrics collected.
For example, an alert can be triggered if disk usage exceeds 80%. Additionally, rules can be set up to predict future conditions and send an alert if it estimates that disk space will be completely filled within the next 24 hours.
Another common use case involves detecting unusual behaviour. For instance, if there is a sudden spike in network bandwidth usage, an alert can be triggered to help detect potential distributed denial-of-service (DDoS) attacks or data exfiltration attempts.
Prometheus alert rules are included directly in the Prometheus server.
Introduction to Alert Manager
Alert Manager receives alerts that Prometheus alert rules have triggered. It deduplicates alerts, groups them, and then forwards them via various notification channels such as email, Slack, Mattermost, PagerDuty, and more. Its configuration file is alert-manager.yml.
For example, if a server slowdown occurs, Prometheus alert rules might trigger separate alerts for increased load and CPU usage. Alert Manager receives these alerts, groups them as they relate to the same server, and sends a single consolidated notification to the appropriate recipient or team based on your configuration.
If the slowdown continues, Prometheus will keep sending alerts but Alert Manager will suppress duplicate messages for a specified period to prevent flooding your team with redundant alerts.
You can also silence or completely inhibit alerts if needed. Once the underlying issue is resolved, a recovery message is sent to notify your teams.
This example illustrates a common scenario, but you can fully customize the setup to meet your specific requirements.
Alert Manageris not included by default with Prometheus. To save you time and simplify the process, we have integrated and configuredAlert Managerin Stackhero for Prometheus so you can send alerts in just a few minutes, with minimal effort.