 Prometheus: Show data on Prometheus
This documentation is part of the Retrieving metrics from Linux guide. View the full guide here: How to retrieve Linux server metrics in Prometheus using Node Exporter.
👋 Welcome to the Stackhero documentation!
Stackhero delivers a fully managed Prometheus cloud platform designed for reliability and simplicity:
Alert Manageris built in, so you can route alerts directly toSlack,Mattermost,PagerDuty, and other popular destinations.- A dedicated email server lets you send unlimited email alerts without extra setup.
Blackboxis included, allowing you to probeHTTP,ICMP,TCP, and other protocols for comprehensive monitoring.- Configure your instance quickly using the online configuration file editor. There is no need to manage YAML by hand.
- Apply updates with a single click. Stackhero handles the upgrade process for you, minimizing downtime and manual intervention.
- High performance and strong security are built in, thanks to your own private, dedicated infrastructure.
Get up and running in about 5 minutes. Stackhero takes care of the setup so you can focus on monitoring, not maintenance. Try Prometheus cloud hosting on Stackhero to streamline your monitoring and alerting workflows.
To view the metrics retrieved from Node Exporter, log in to Prometheus via the Stackhero dashboard using the "Prometheus UI" URL or directly at https://<prometheusDomain>/.
In the "Expression" field, type node_memory_MemTotal_bytes and press enter. If everything is configured correctly, you will see the server's total RAM displayed in bytes.
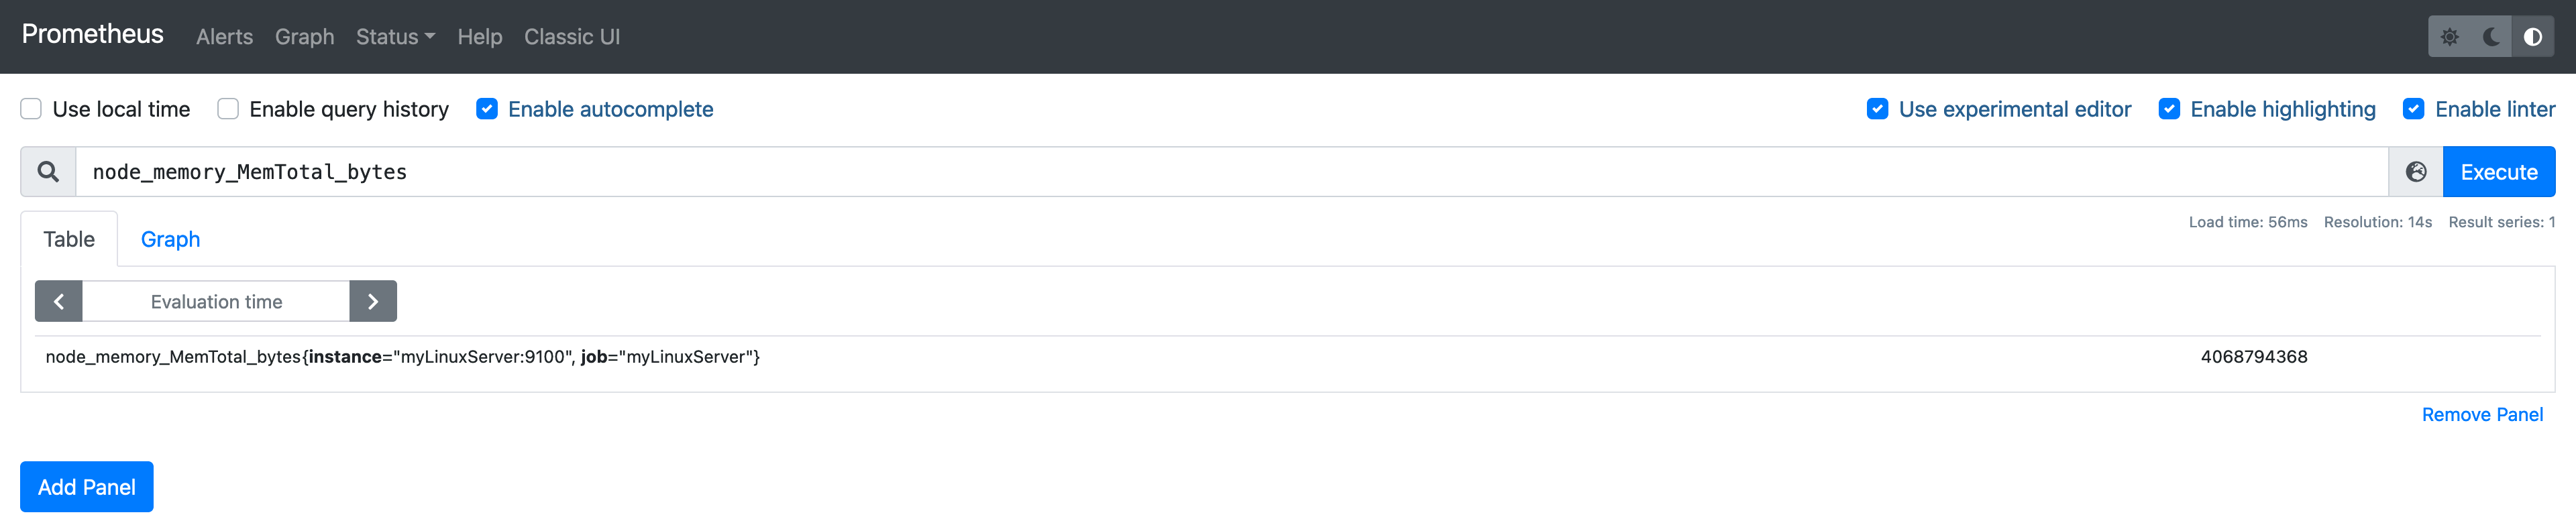 The total amount of RAM for this server is 4068794368 bytes which is 3.78GB