 Grafana: Using Prometheus
How to configure Grafana to use Prometheus as a data source
👋 Welcome to the Stackhero documentation!
Stackhero gives you a ready-to-use Grafana cloud environment built for quick setup and reliable performance:
- Unlimited users, dashboards, and alerts: scale your monitoring as needed, without artificial limits.
- Dedicated SMTP email server included, so you can send all the notifications you want, with no quotas to track.
- One-click plugin installation streamlines adding new features to Grafana.
- Built-in SSO support for
GitLab,GitHub,OAuth2provider. User management stays simple and secure.- One-click updates keep your Grafana instance current, with no downtime or maintenance hassle.
- Use your own custom domain with automated HTTPS provisioning for secure, branded access (for example, https://grafana.your-company.com).
- High performance and strong security are standard, running on your own private, dedicated infrastructure.
Get started faster and save setup time: a secure Grafana cloud hosting instance is ready in about 5 minutes.
How to configure Prometheus as a data source in Grafana
Integrating Prometheus with Grafana enhances your ability to visualize metrics effectively. Follow this guide for a straightforward setup process.
Accessing the data source configuration
- Open the Grafana web user interface (UI).
- Navigate to
Configuration>Data Sources. - Click on
Add Data Source. - From the list of available sources, select
Prometheus.
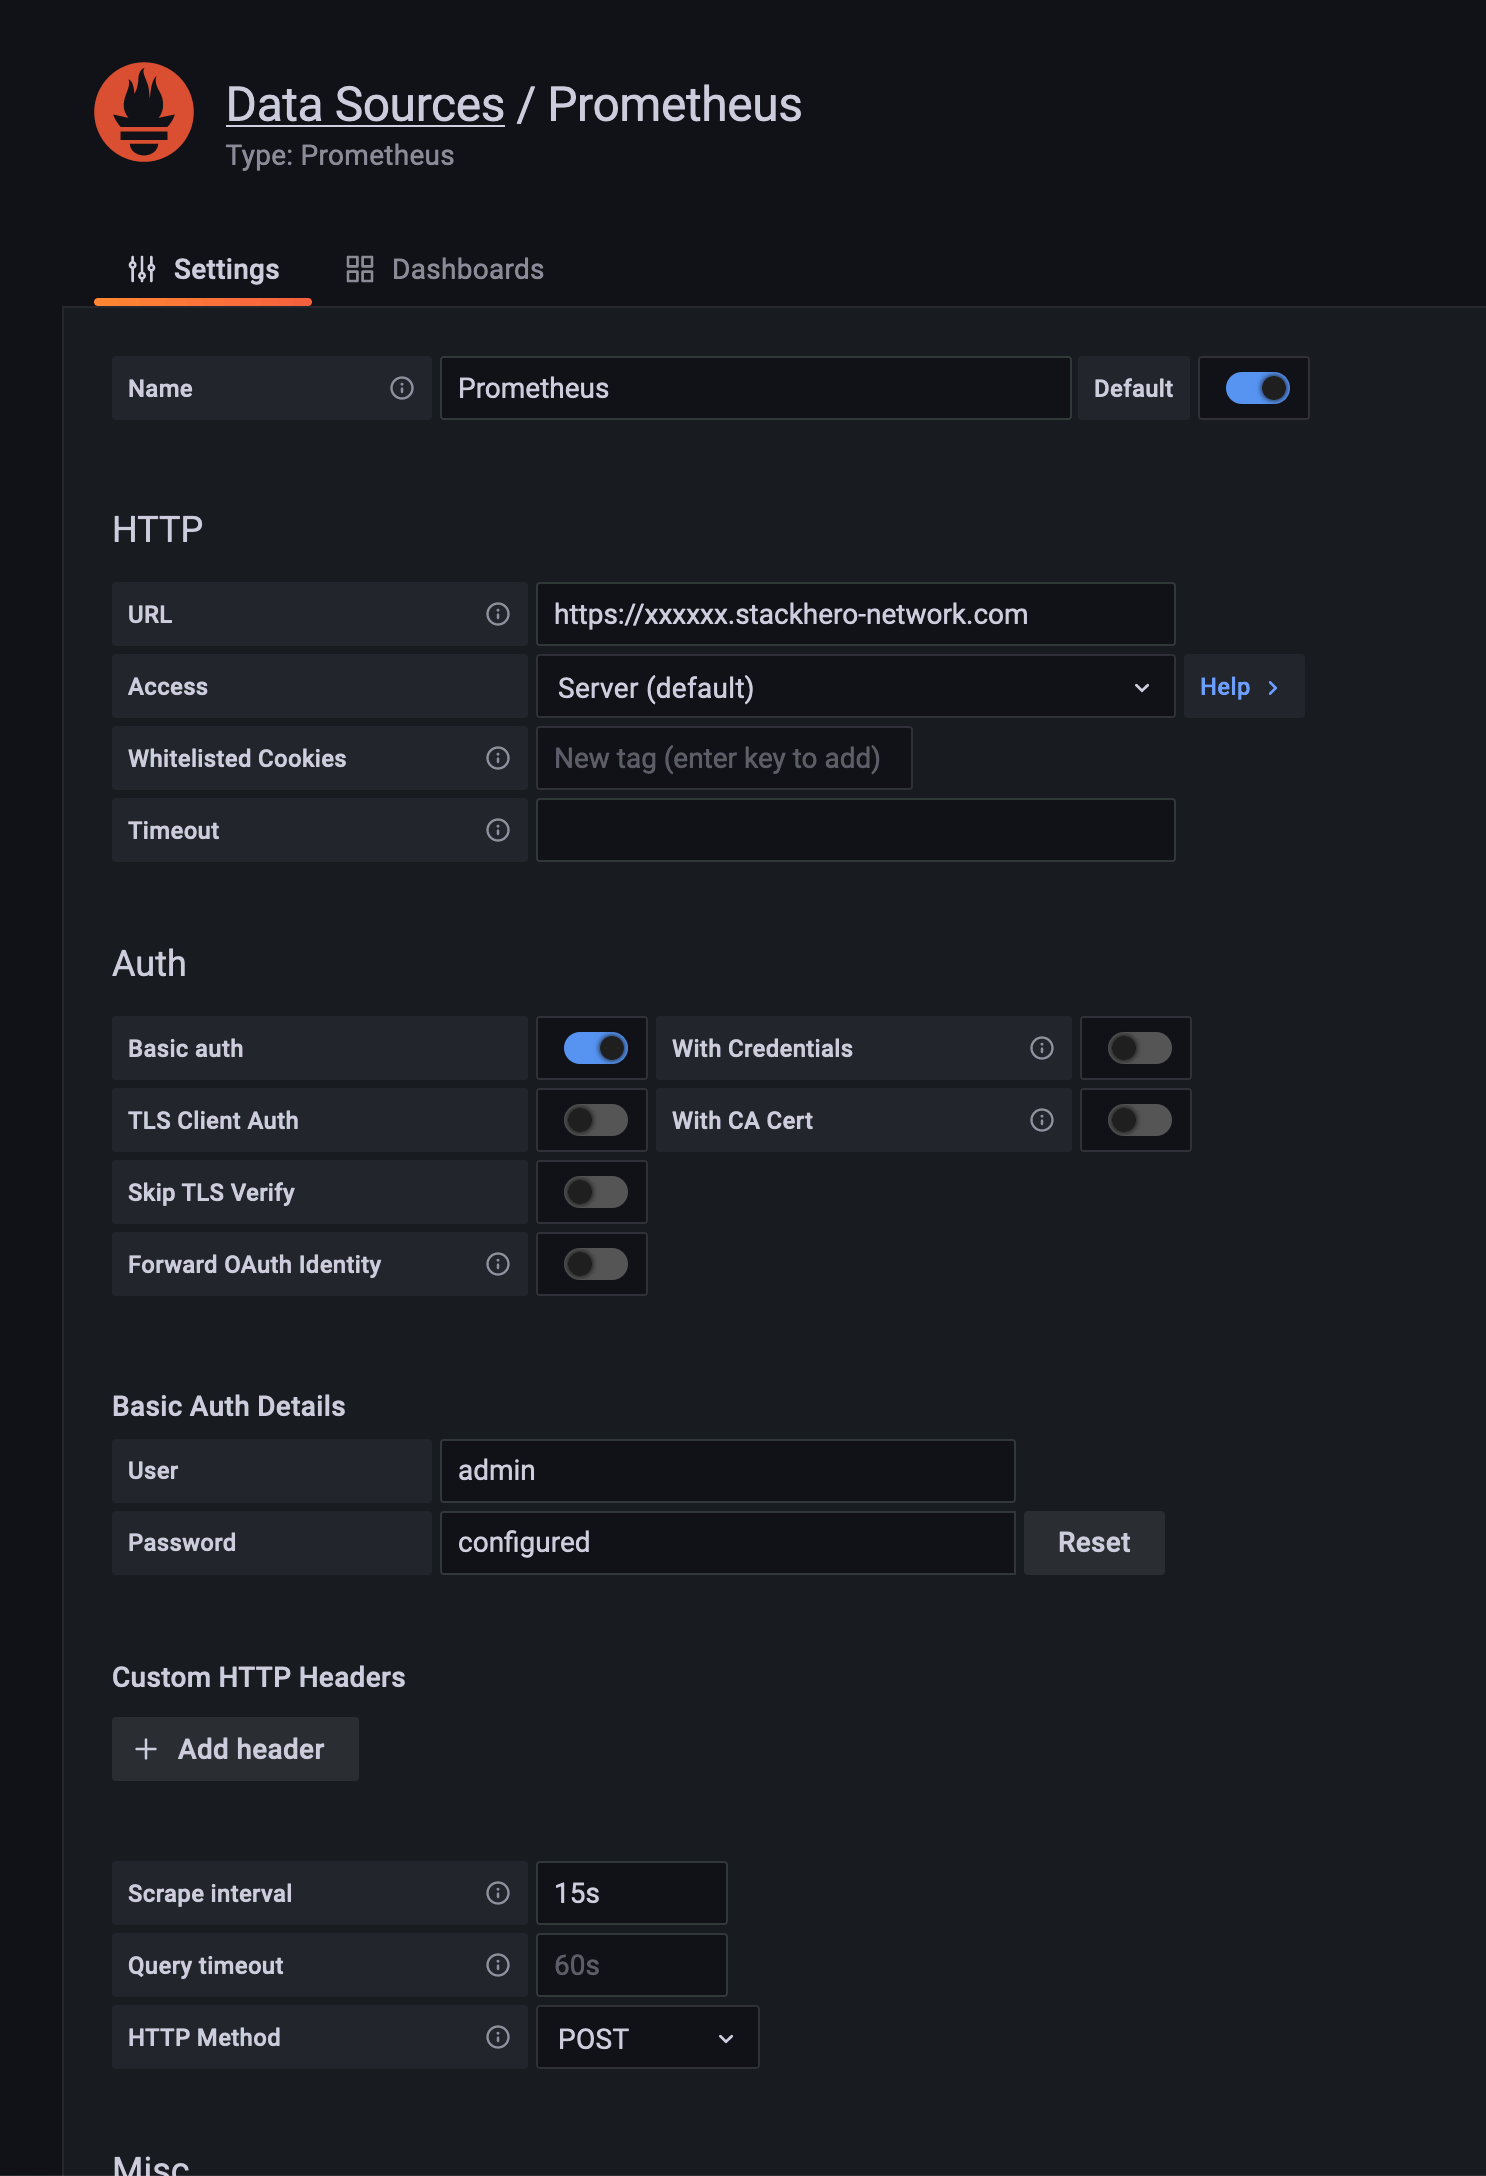 Example of Prometheus configuration as data source
Configuring the Prometheus data source
Follow these steps to properly set up Prometheus as a data source:
- URL: Provide the Prometheus service URL, such as
https://<XXXXXX>.stackhero-network.comor your custom domain. - Authentication: Enable
Basic Auth, setadminas the username, and provide your Prometheus password. You can find this password in the Stackhero dashboard under the Prometheus service settings. - Scrape Interval: Ensure the
Scrape Intervalaligns with your Prometheus server configuration. The default is15sunless it has been adjusted.
After entering these details, click Save & Test to verify the connection is functional.
Adding a Node Exporter dashboard
If your Prometheus server includes a Node Exporter target, you can quickly import a pre-built dashboard into Grafana to monitor its metrics:
- In the Grafana UI, navigate to
Create>Import. - Under
Import via grafana.com, input the ID1860and clickLoad. - Select your Prometheus data source.
- Click
Importto add the dashboard.
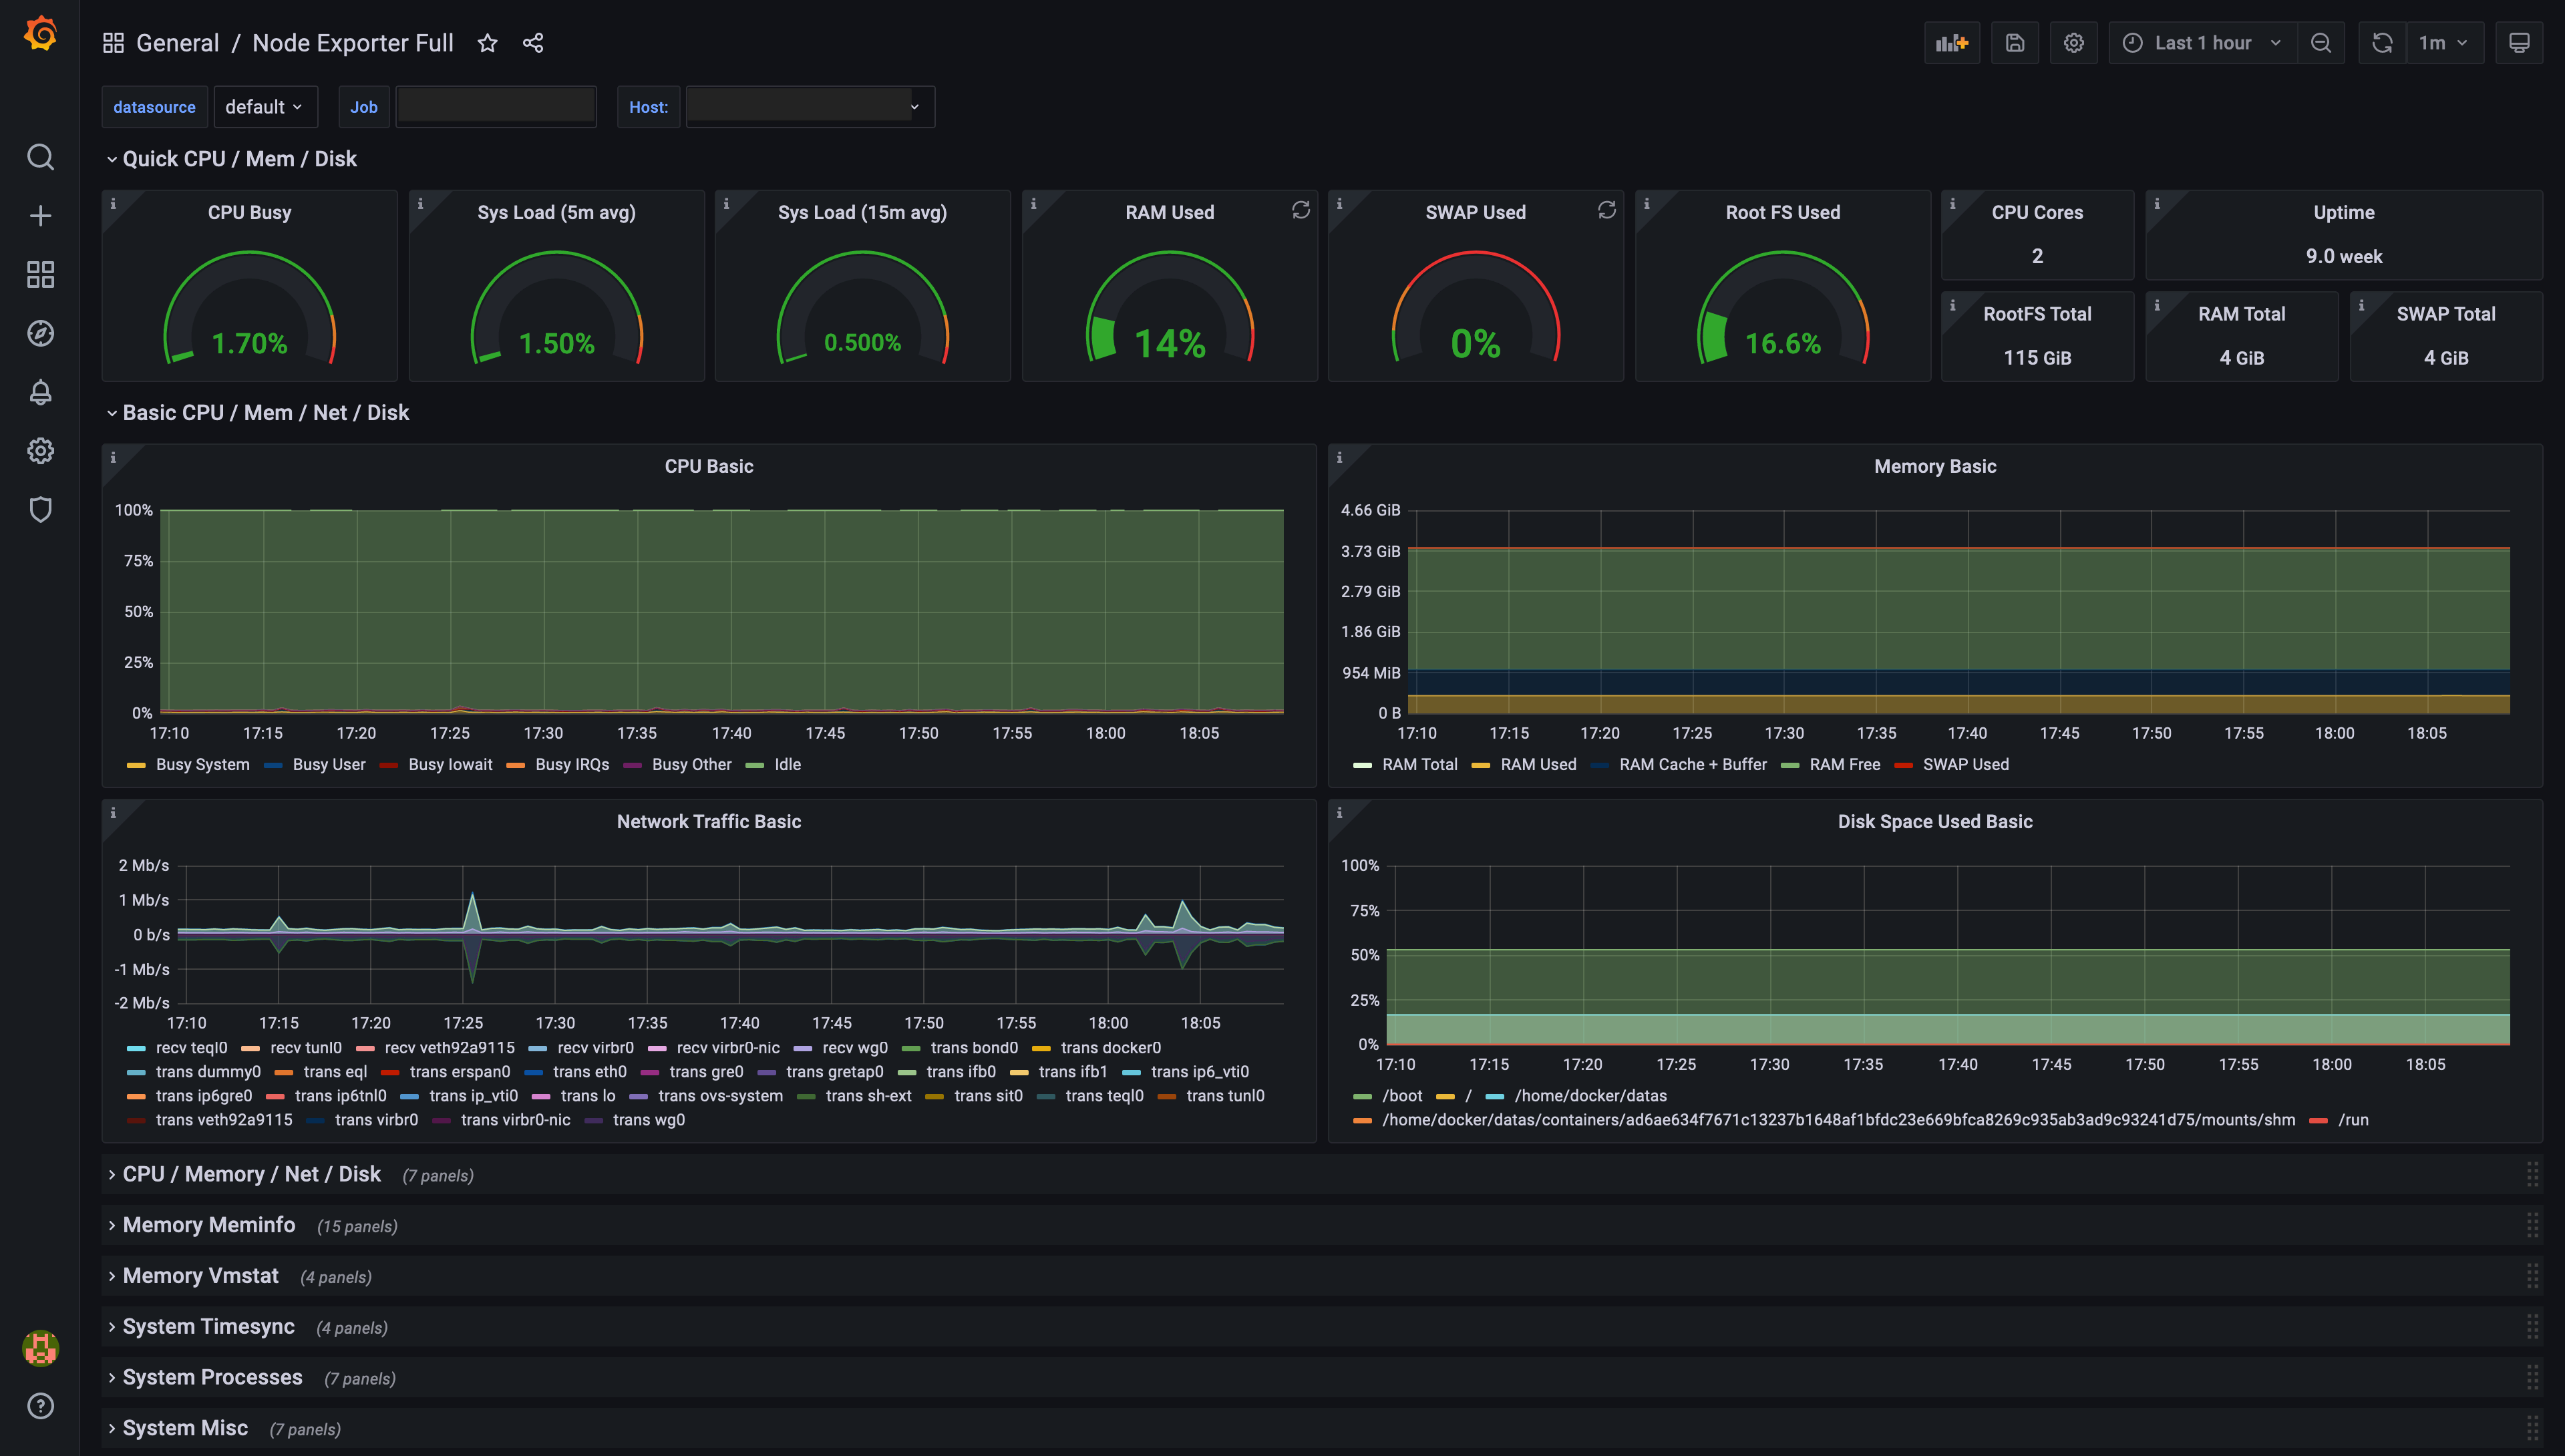 Example of a dashboard generated by Grafana, based on Prometheus Node Exporter data
You now have a Grafana dashboard displaying metrics from the Node Exporter. Use the Job selector in the top left to switch between instances.
Adding a Blackbox Exporter dashboard
Grafana supports pre-configured dashboards for the Blackbox Exporter. To add one:
- In the Grafana UI, go to
Create>Import. - Enter one of the following IDs:
7587,11175,11529, or13659, and clickLoad. - Select your Prometheus data source and click
Import.
This process adds a dashboard designed for Blackbox Exporter data visualization. Use the Job selector at the top left to focus on specific instances.
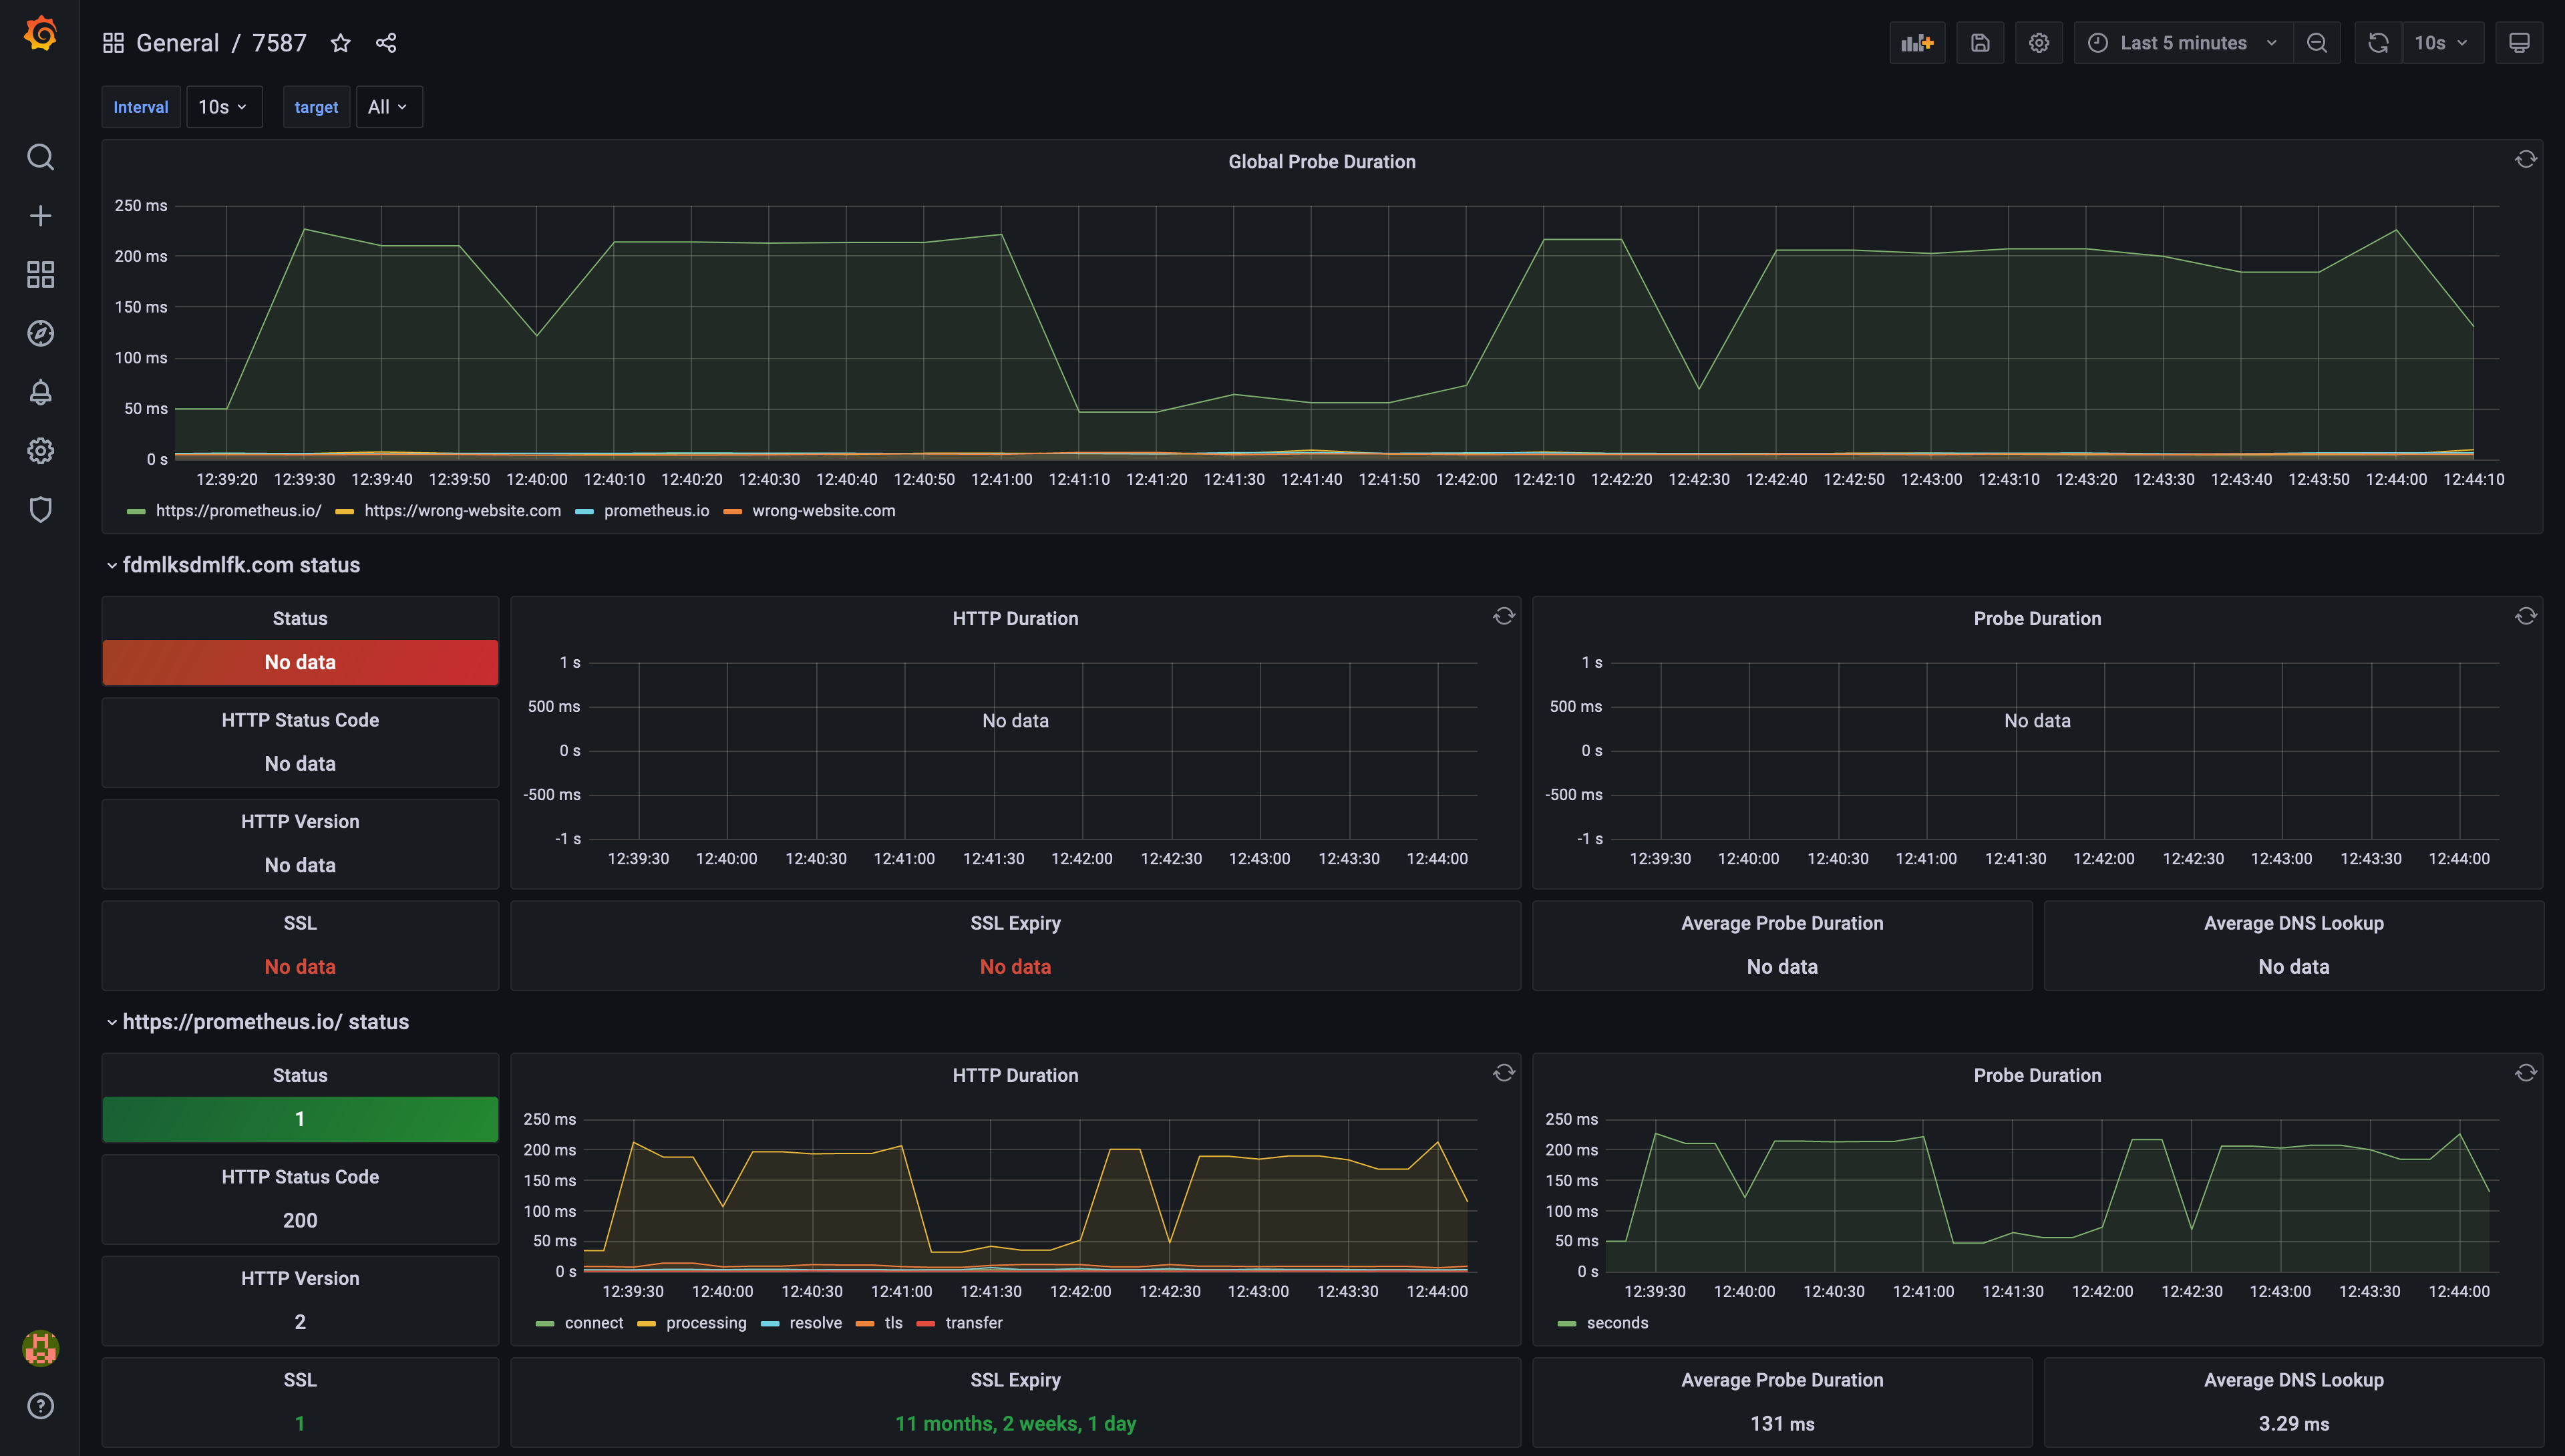 Example of pre-configured dashboard ID 7587
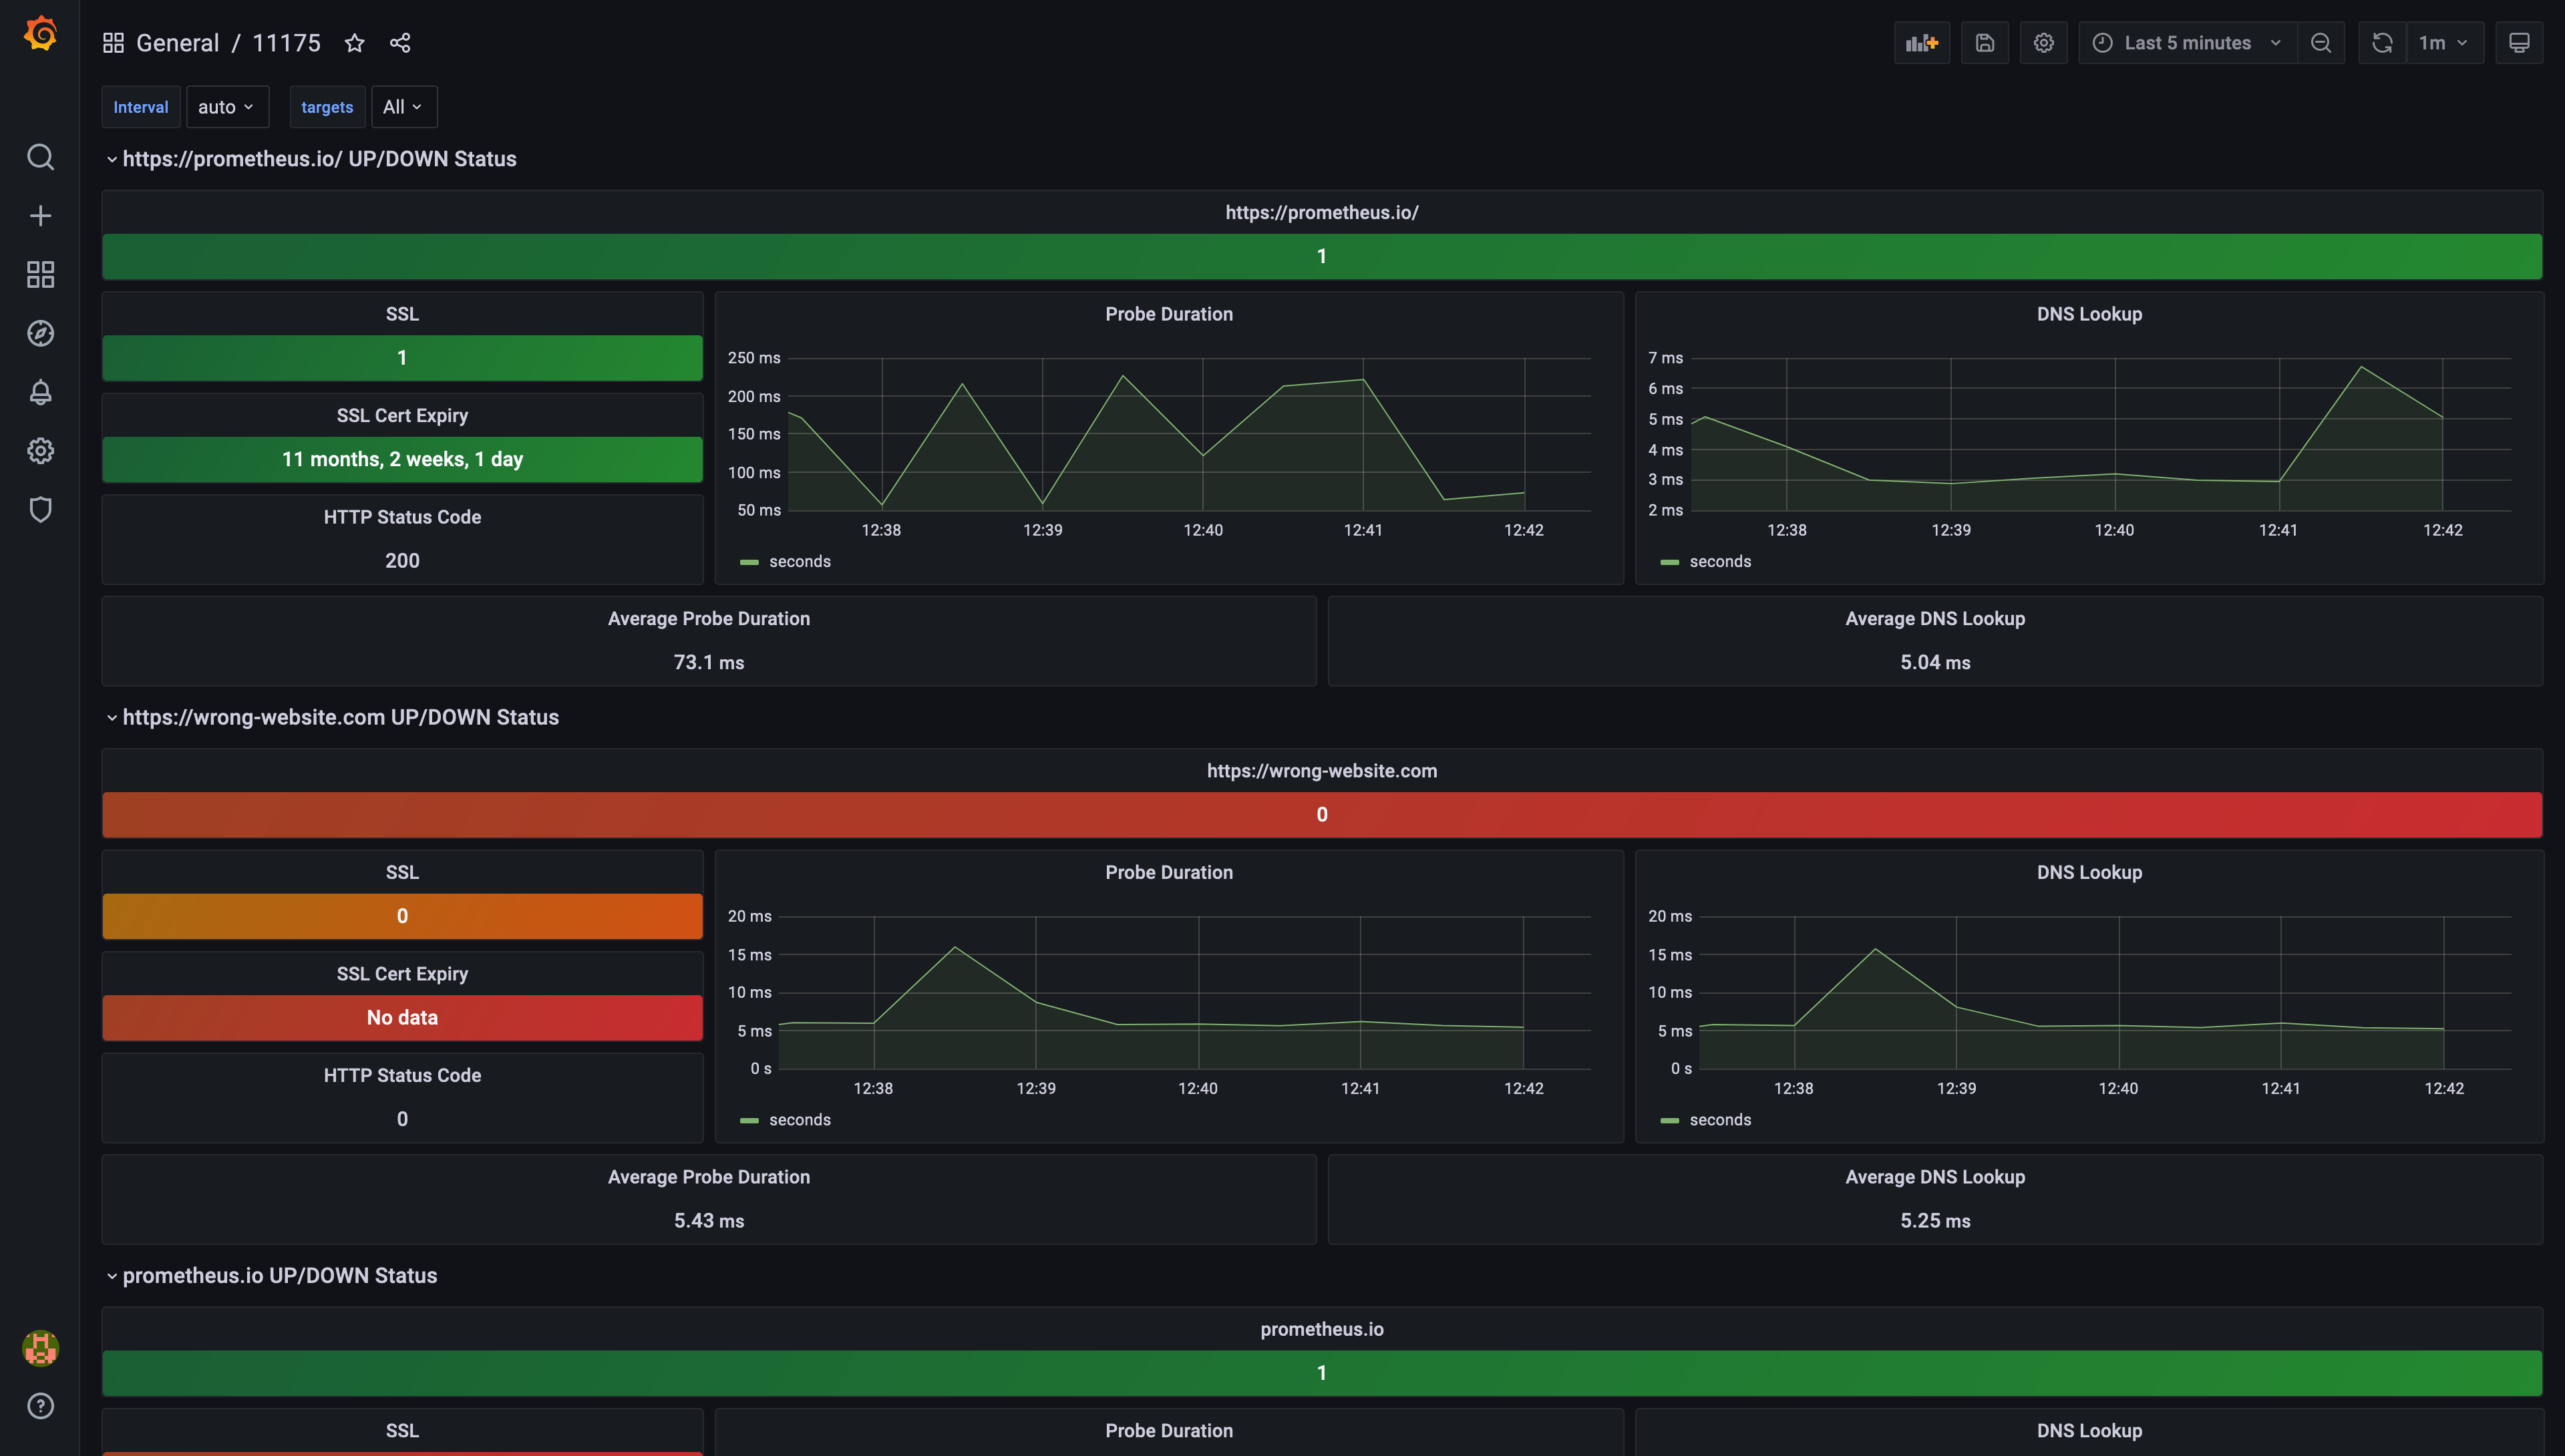 Example of pre-configured dashboard ID 11175
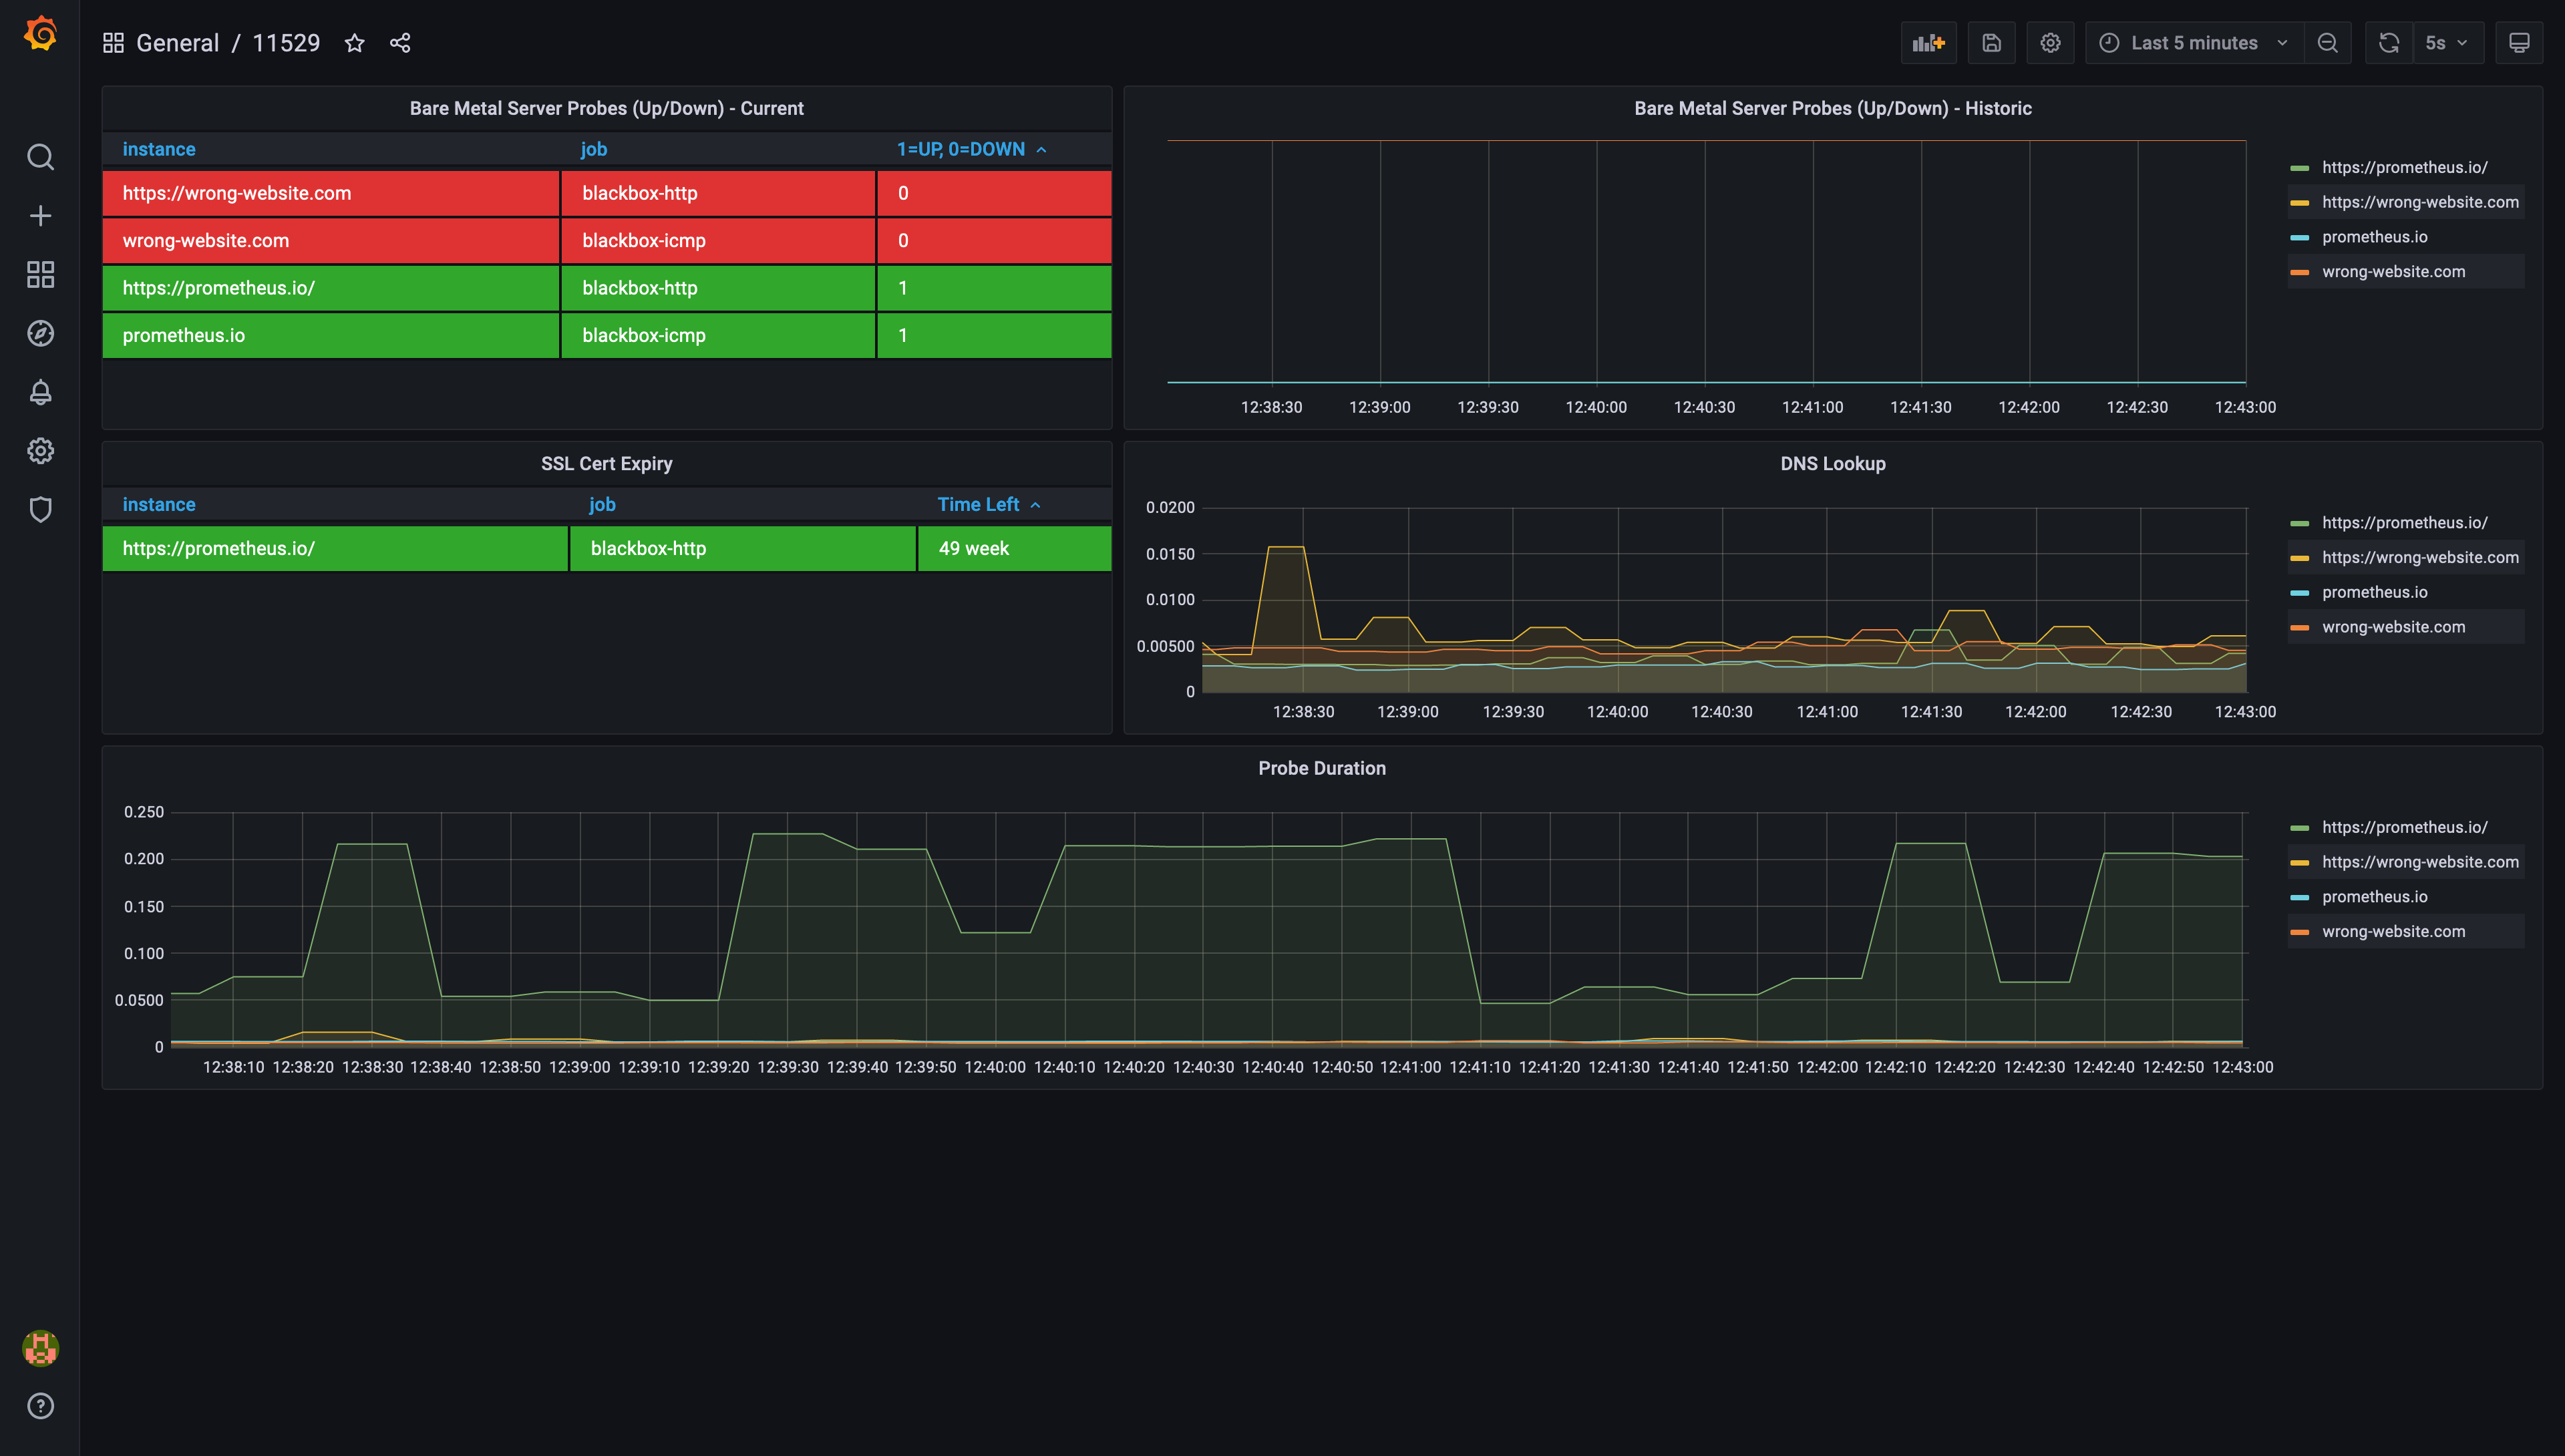 Example of pre-configured dashboard ID 11529
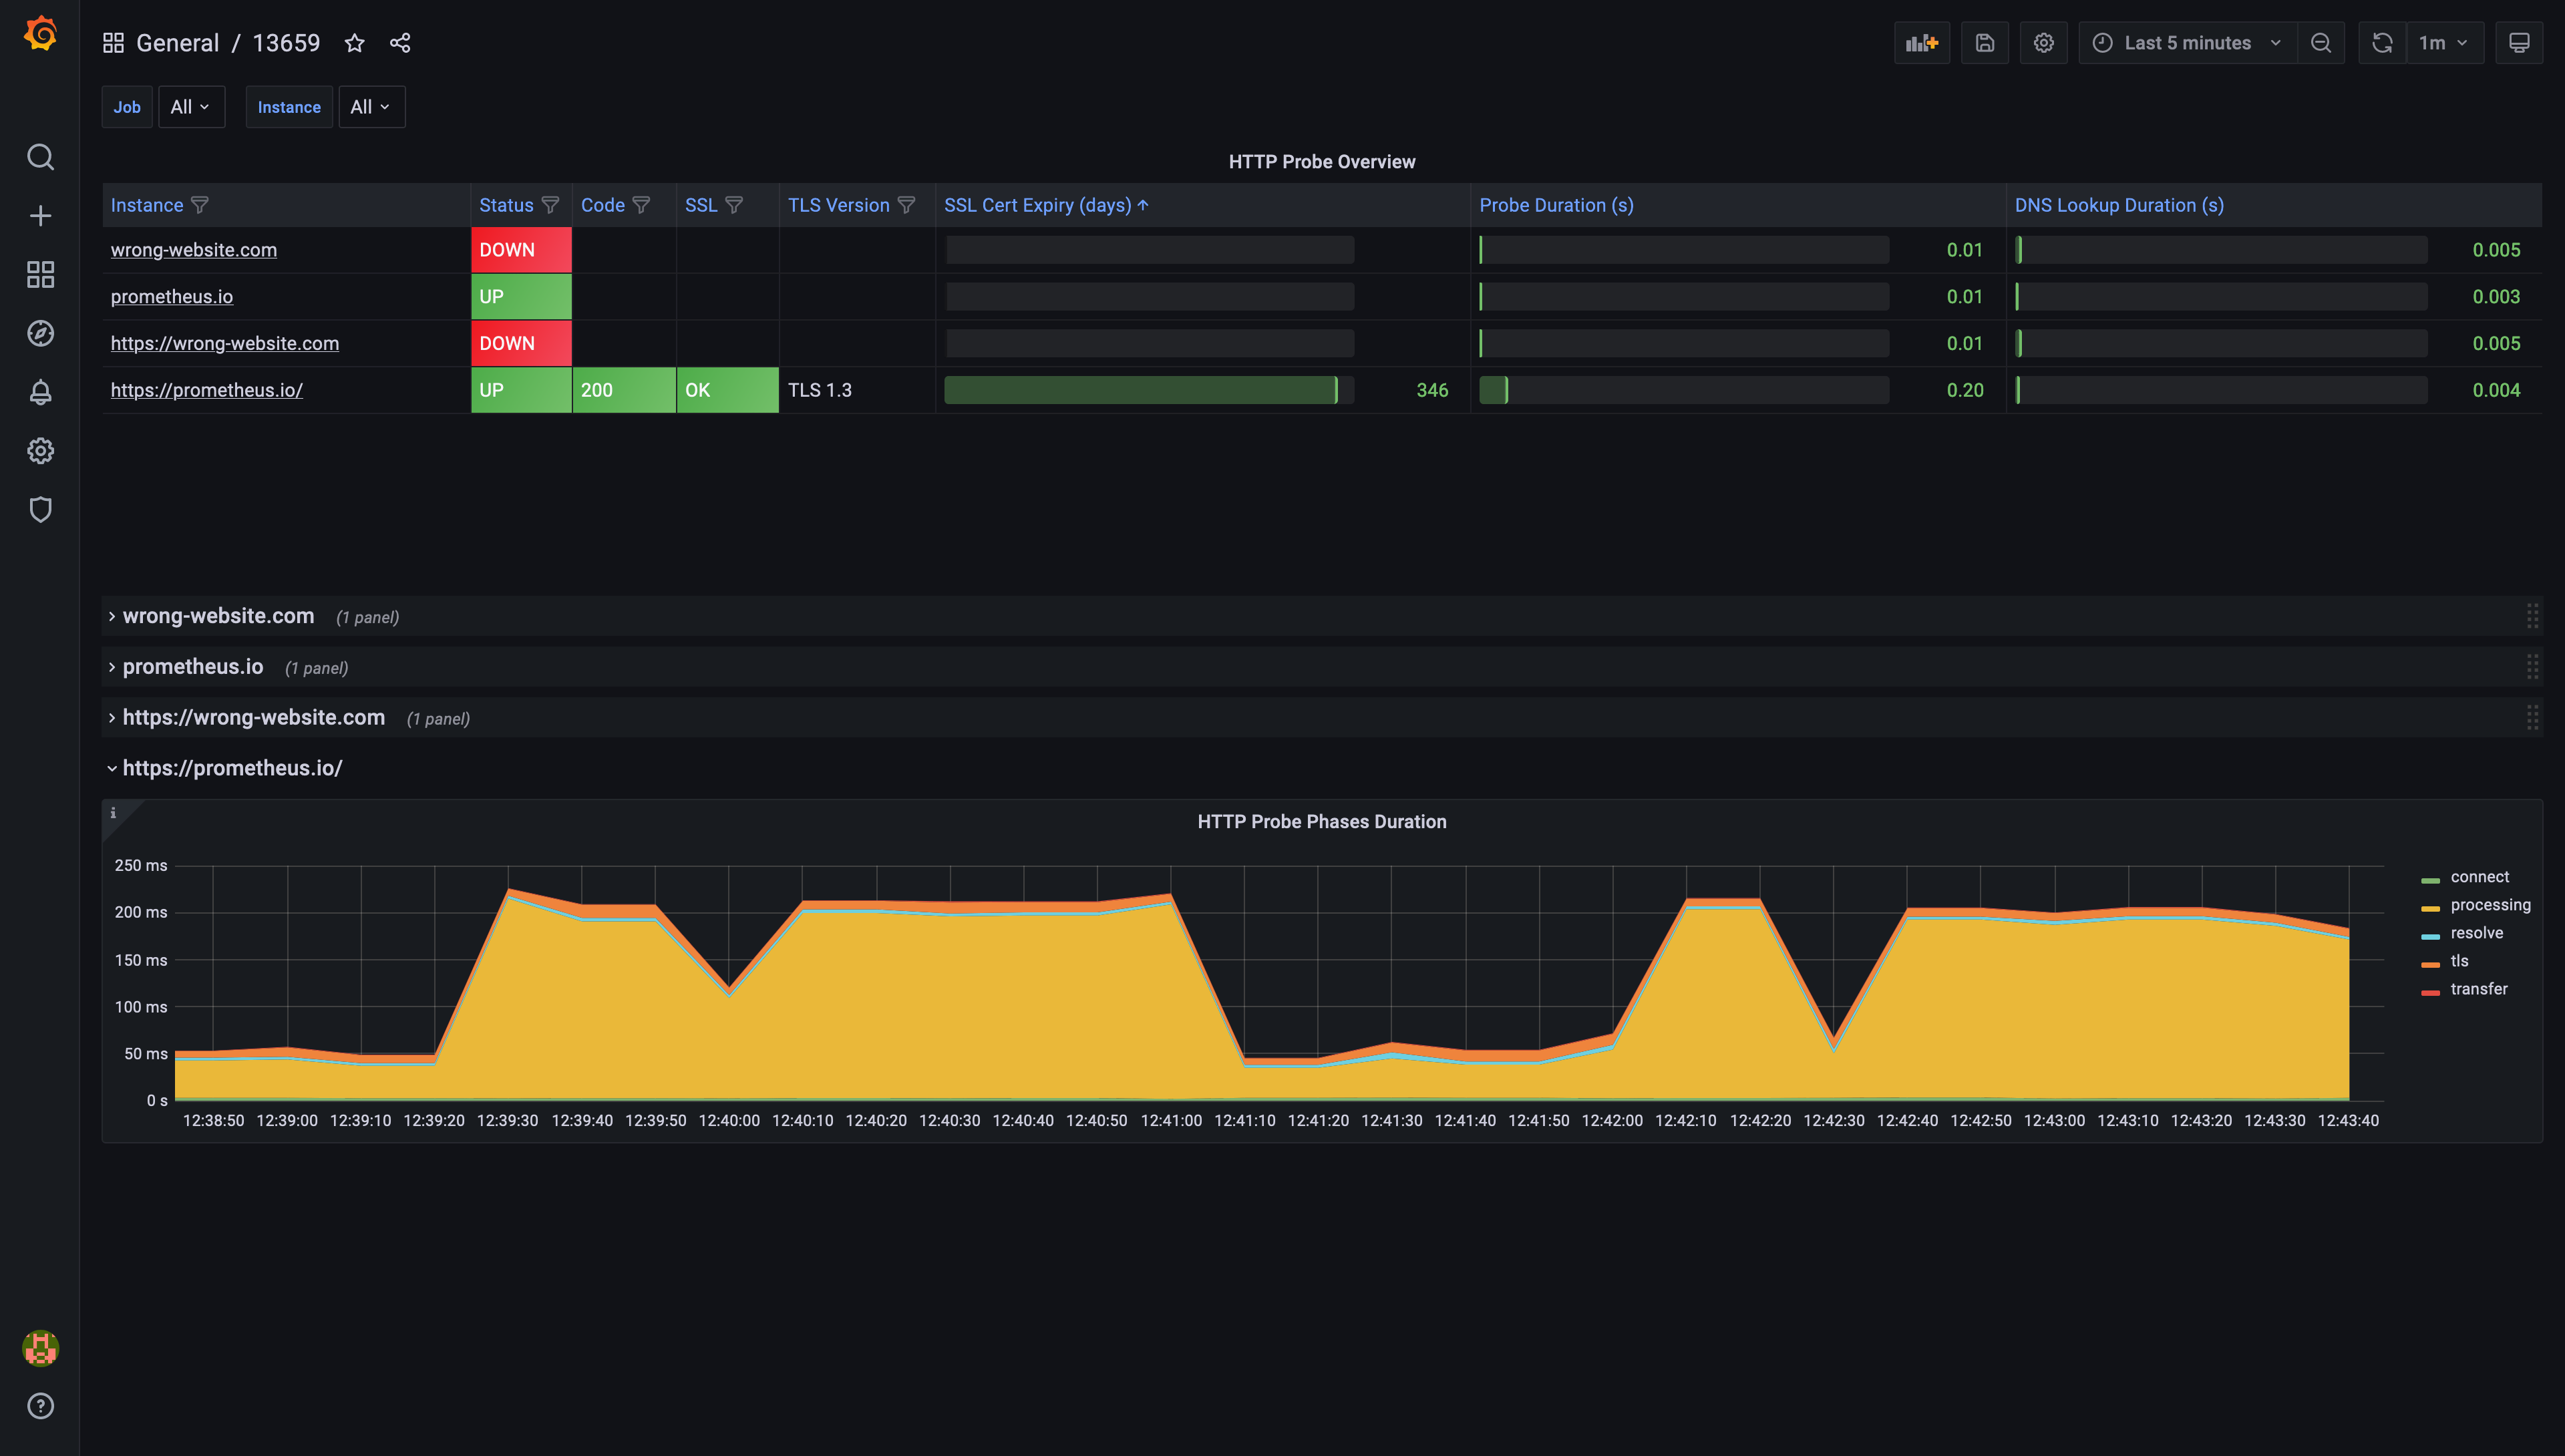 Example of pre-configured dashboard ID 13659
Troubleshooting missing data points in Grafana charts
Are you noticing gaps in your Grafana charts? A common cause is a mismatch in scrape intervals between Prometheus and Grafana. Here is how you can address this:
- Open your Prometheus configuration file and check the
global/scrape_intervalsetting. For Stackhero's Prometheus instance, the default is typically15s.
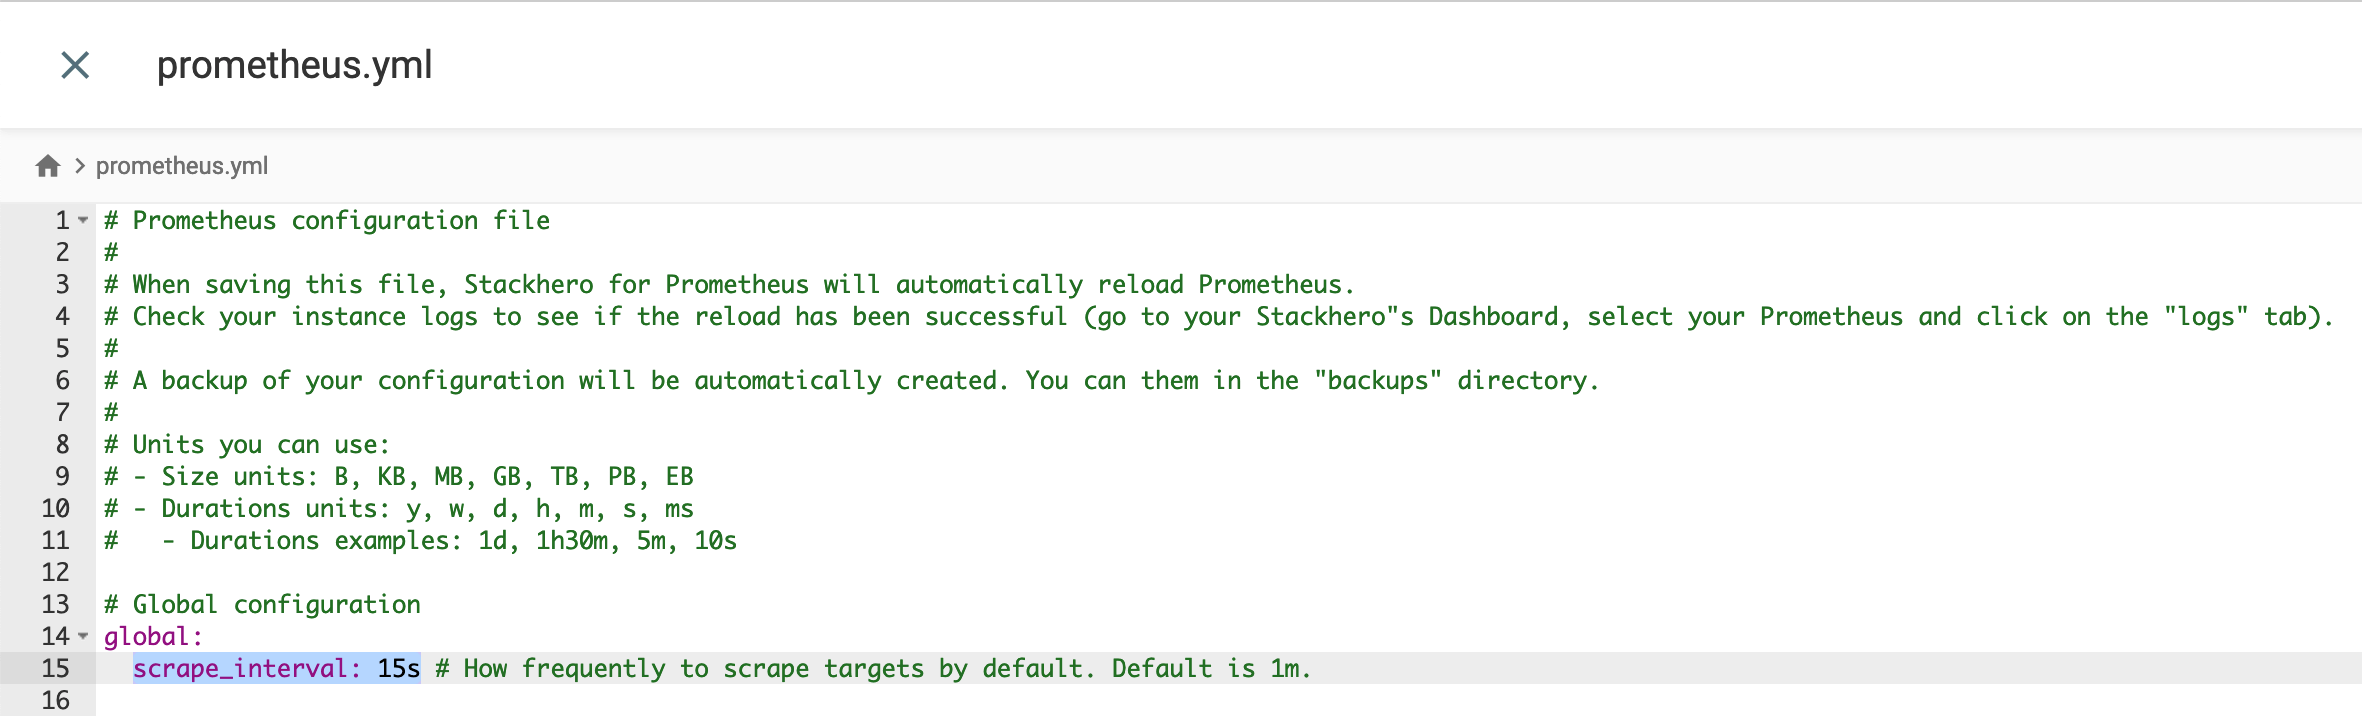 Prometheus default configuration
- In the Grafana UI, navigate to
Configuration>Data Sourcesand selectPrometheus. - Ensure the
Scrape Intervalin Grafana matches thescrape_intervalin your Prometheus configuration.
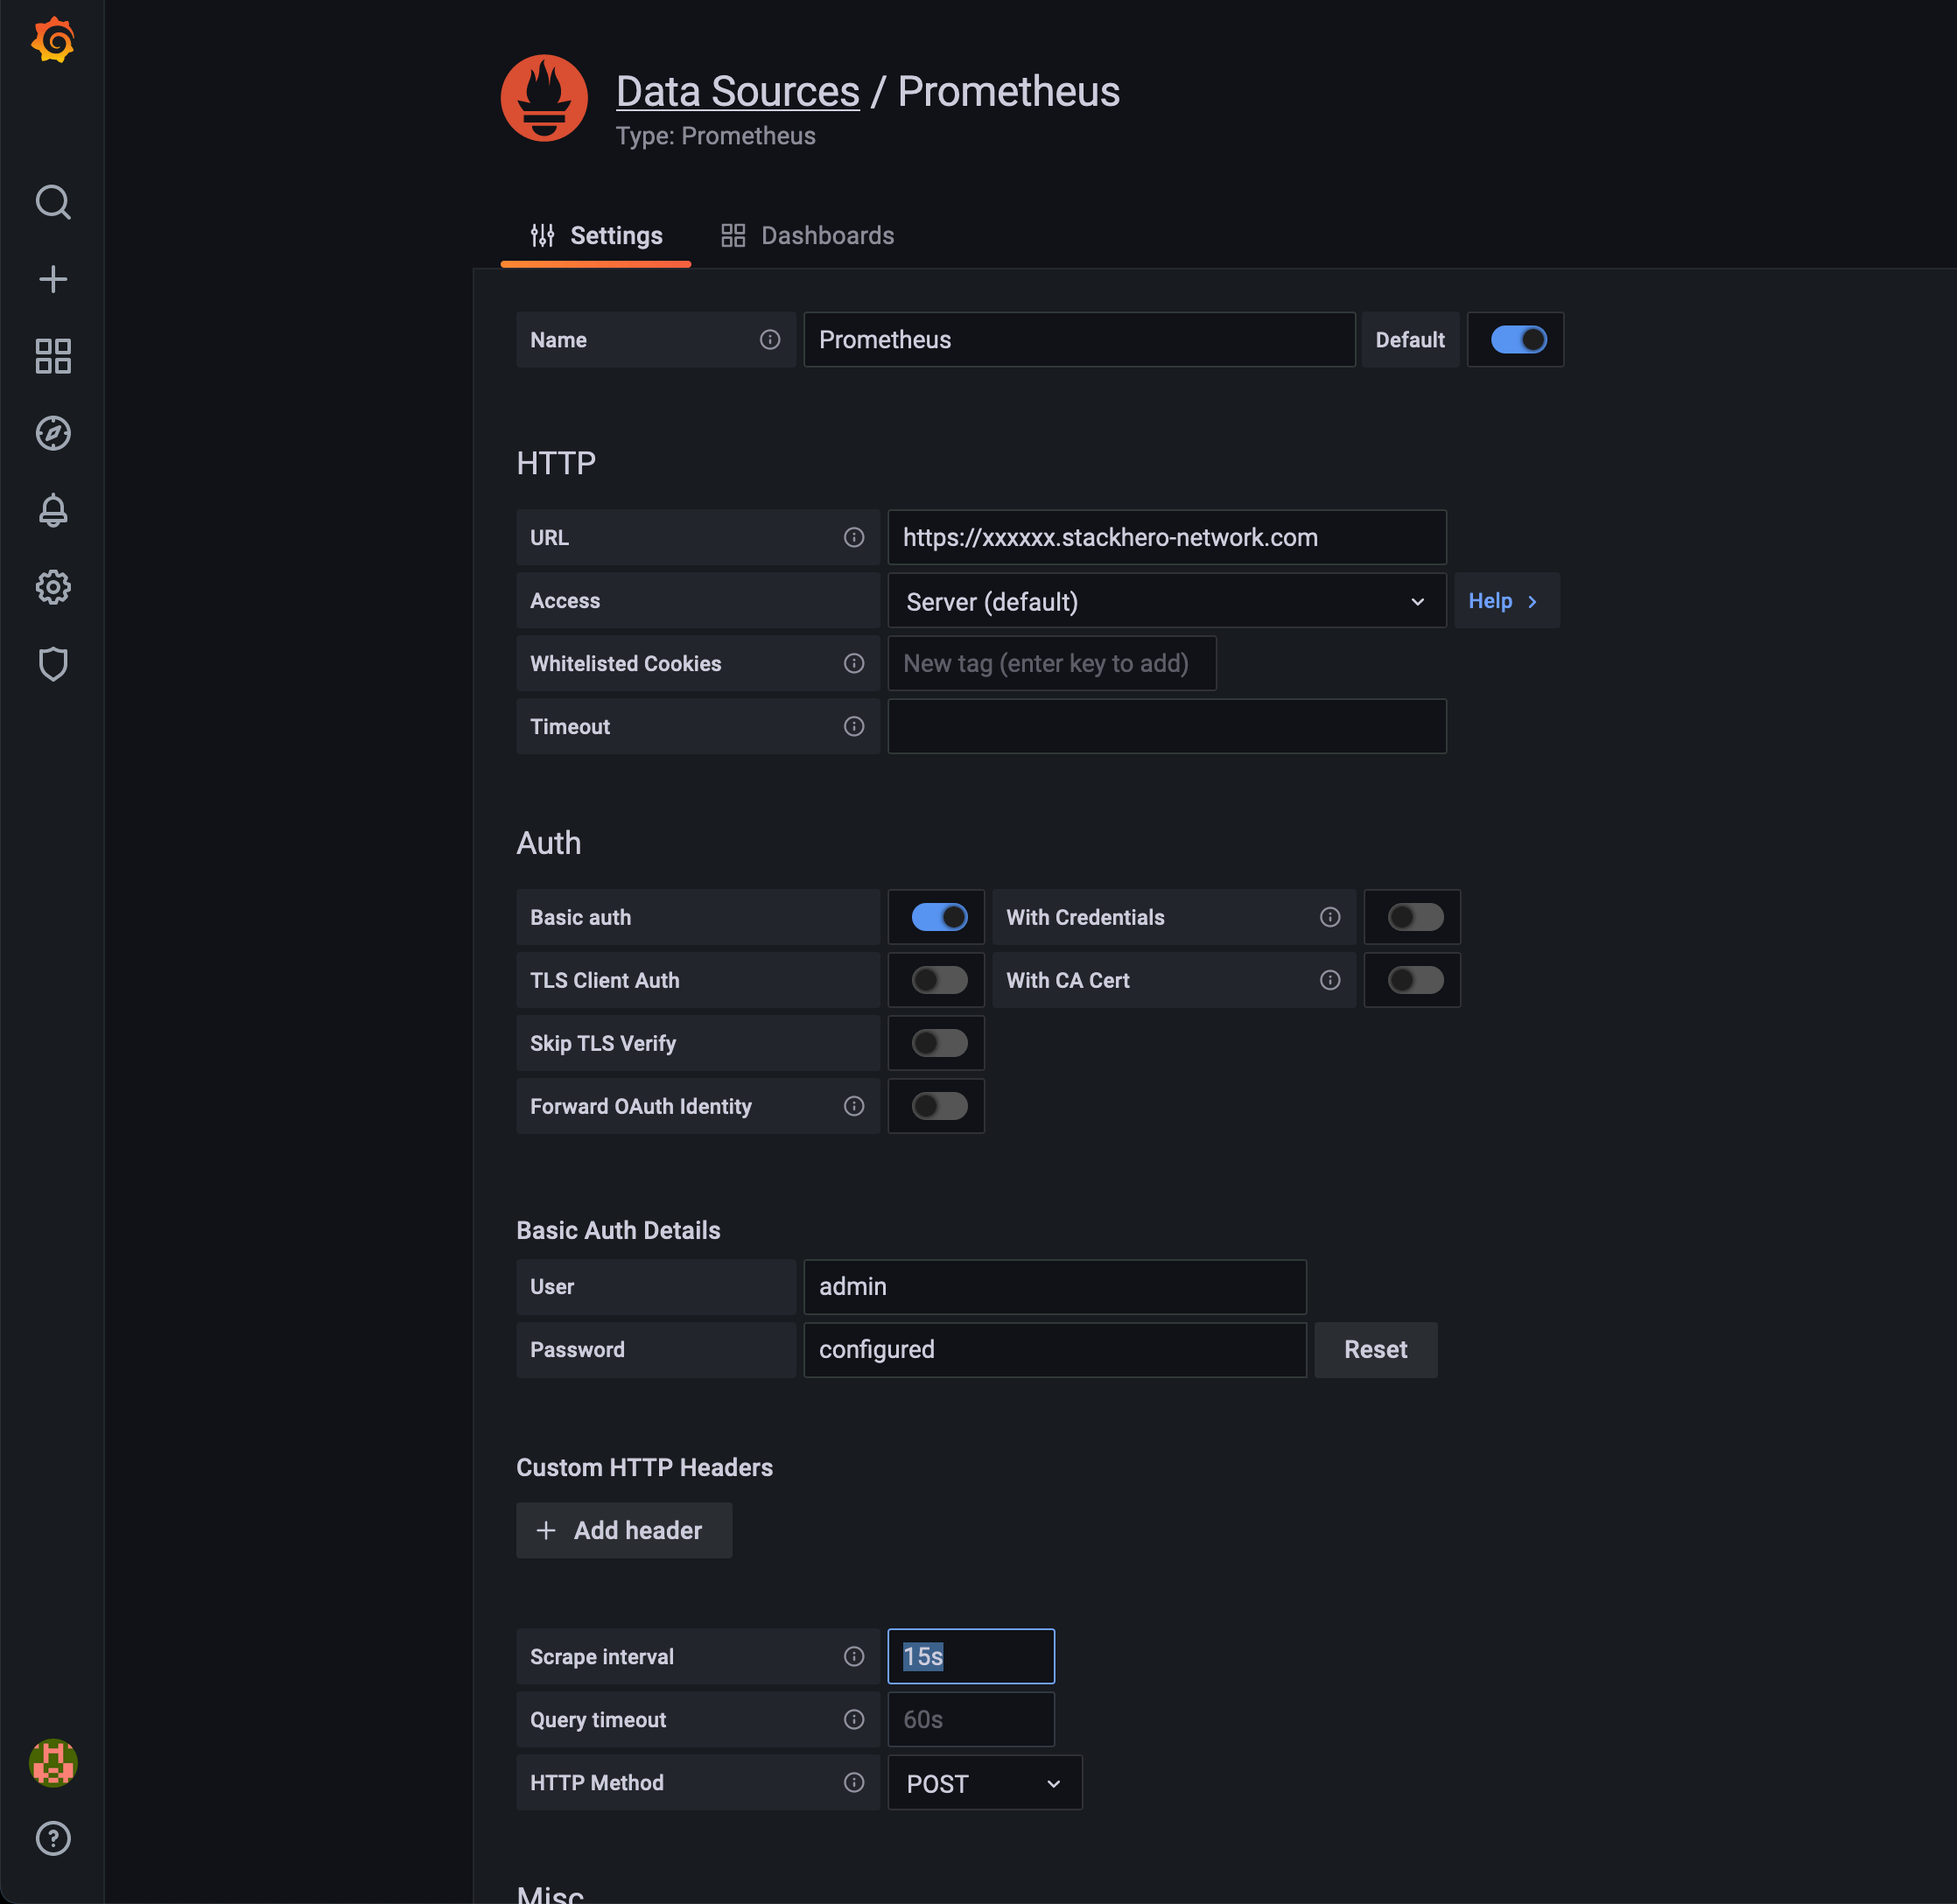 Prometheus data source configuration in Grafana
By aligning the scrape intervals, you can resolve most issues related to missing data points in your dashboards.