 Node-RED: How to catch and log errors from Node-RED nodes
This documentation is part of the Getting started guide. View the full guide here: How to get started with Node-RED.
Welcome to the Stackhero documentation
Stackhero provides a fully managed Node-RED cloud environment designed to get you building workflows quickly:
- Built-in MQTT server (Mosquitto) for seamless IoT integration.
- Full access to the Node-RED admin UI for managing flows and settings.
- Node-RED Dashboard included for real-time visualization.
- Dedicated SMTP email server included, with no limits on sending.
- Effortless one-click updates to keep your instance current.
- Custom domain names with automatic HTTPS: for example, https://node-red.your-company.com.
- High performance and strong security with private, dedicated infrastructure.
You can have a secure, production-ready Node-RED cloud hosting instance running in about 5 minutes. Stackhero handles setup, updates, and infrastructure so you can focus on building automations.
At times, nodes may generate errors. A practical solution is to set up a "catch all debug" flow to monitor these errors.
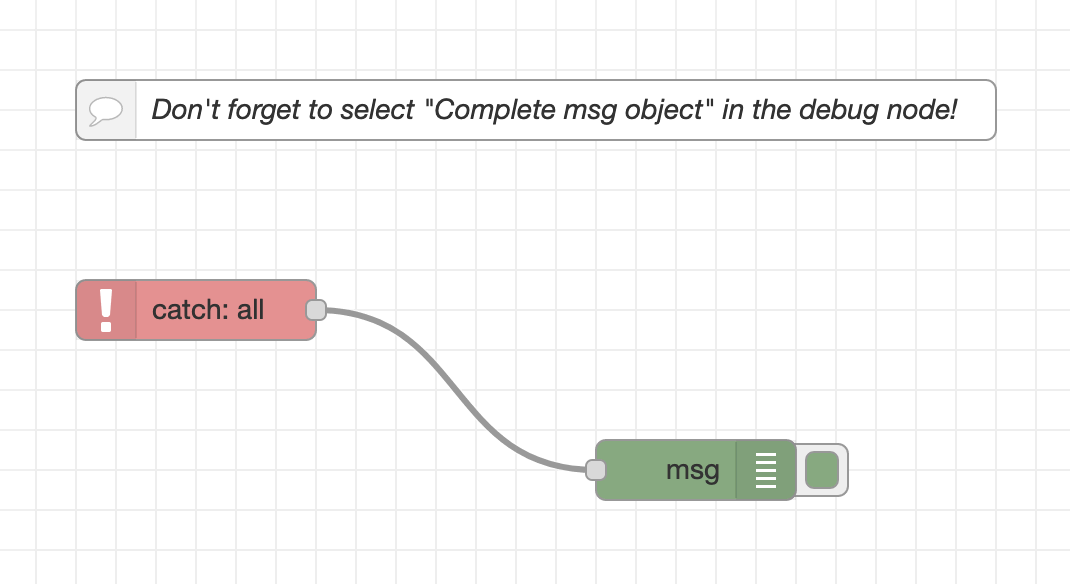 Example of a Node-RED error catch flow
To set this up, add a catch node and connect it to a debug node. Configure the debug node to output the complete msg object. This setup logs each error generated in the flow to the Node-RED debug window.
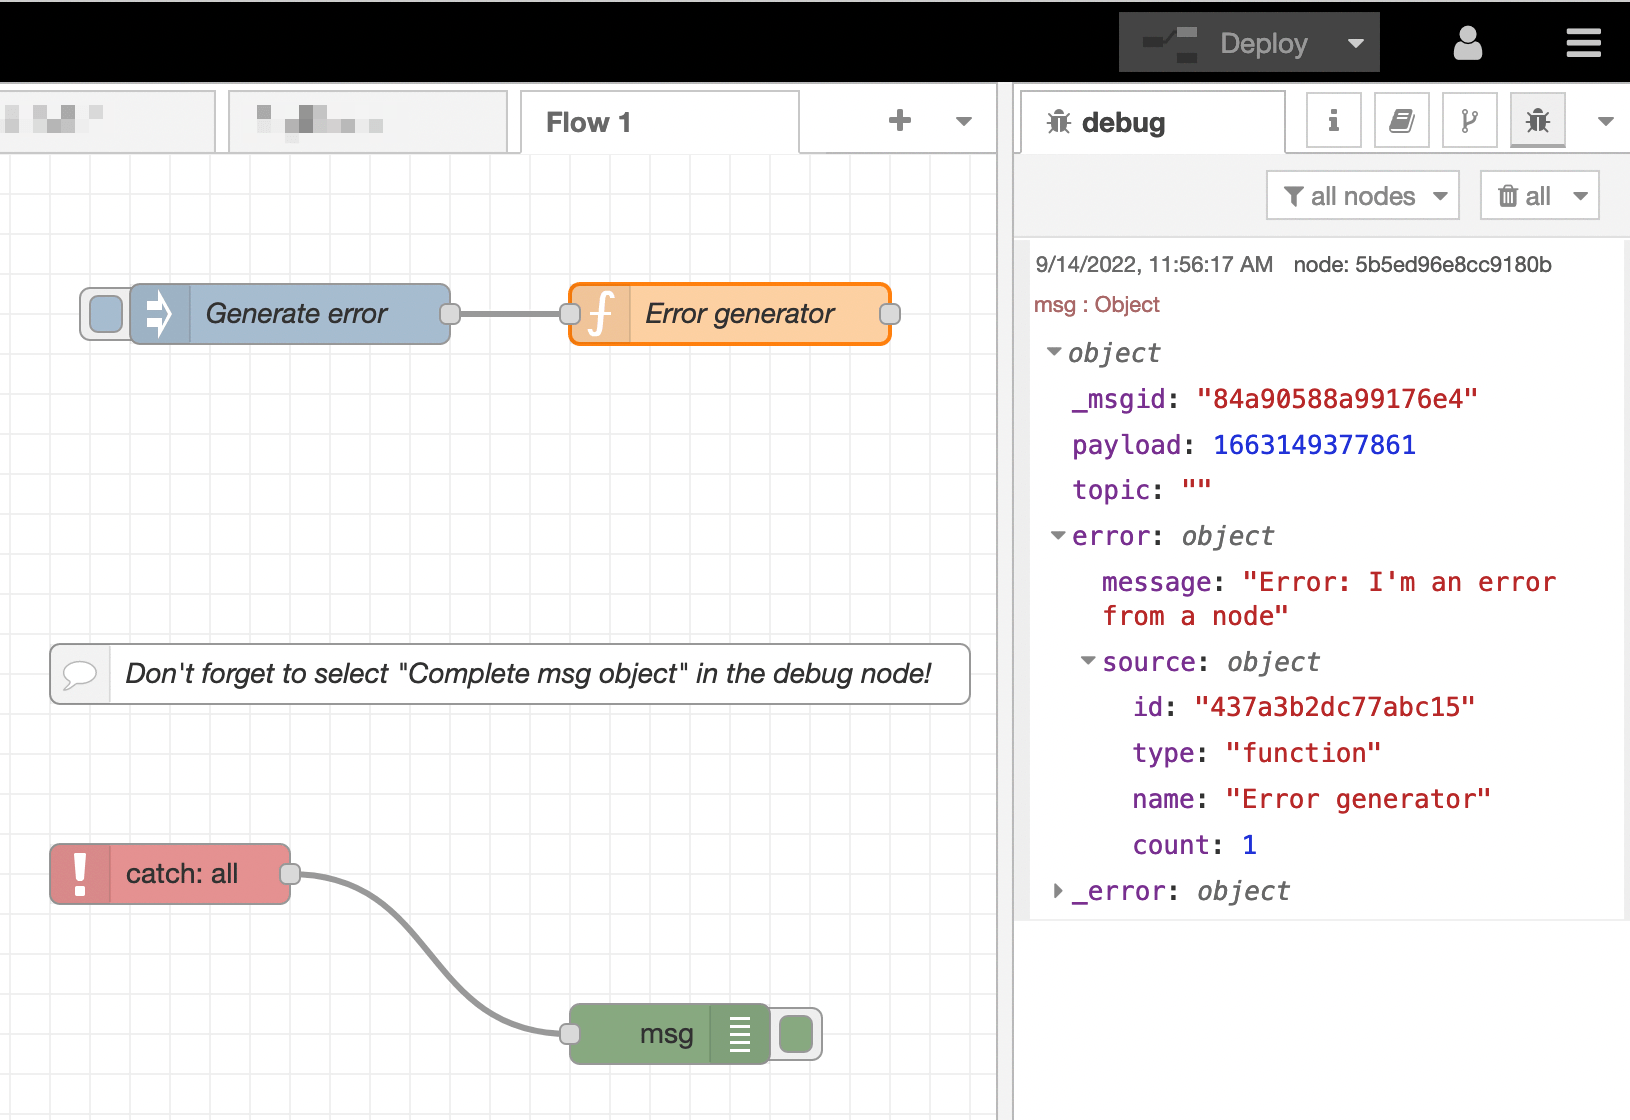 Example of a Node-RED node error caught
A
catchnode is only triggered by errors from nodes within the same flow. If you use multiple flows (or tabs), you will need to add thecatchanddebugnodes to each flow.