 Prometheus: Prometheus Blackbox Exporter configuration
This documentation is part of the Blackbox Exporter guide. View the full guide here: How to use Prometheus Blackbox Exporter to probe HTTP and ICMP (ping) endpoints.
👋 Welcome to the Stackhero documentation!
Stackhero delivers a fully managed Prometheus cloud platform designed for reliability and simplicity:
Alert Manageris built in, so you can route alerts directly toSlack,Mattermost,PagerDuty, and other popular destinations.- A dedicated email server lets you send unlimited email alerts without extra setup.
Blackboxis included, allowing you to probeHTTP,ICMP,TCP, and other protocols for comprehensive monitoring.- Configure your instance quickly using the online configuration file editor. There is no need to manage YAML by hand.
- Apply updates with a single click. Stackhero handles the upgrade process for you, minimizing downtime and manual intervention.
- High performance and strong security are built in, thanks to your own private, dedicated infrastructure.
Get up and running in about 5 minutes. Stackhero takes care of the setup so you can focus on monitoring, not maintenance. Try Prometheus cloud hosting on Stackhero to streamline your monitoring and alerting workflows.
Setting up the Blackbox Exporter involves working with two key files: blackbox-exporter.yml for core settings and prometheus.yml to define how Prometheus scrapes data from the exporter.
Configuring the Blackbox Exporter core
The core configuration, found in the blackbox-exporter.yml file, specifies which protocols to support and how they should be monitored.
On Stackhero for Prometheus, this file is preconfigured to support both ICMP monitoring and HTTP/HTTPS monitoring (via GET and POST requests) right out of the box. If you need to tailor this file for more advanced scenarios, you can check out configuration examples in the Blackbox Exporter repository and consult the official documentation for further guidance.
Configuring the Prometheus Blackbox Exporter target
Most of your configuration will take place in the prometheus.yml file, where you instruct Prometheus to scrape data from the Blackbox Exporter like any other exporter.
For instance, consider the configuration below that checks ICMP (ping) responses from prometheus.io and grafana.com every 15 seconds (as defined by the scrape_interval). You can add this block to your prometheus.yml file within the scrape_configs section and update the targets array with the domain names or IP addresses you wish to monitor:
  - job_name: "blackbox-icmp"
    metrics_path: "/blackbox-exporter/probe"
    params:
      module: [ "icmp" ]
    relabel_configs:
      - source_labels: [ "__address__" ]
        target_label: "__param_target"
      - source_labels: [ "__param_target" ]
        target_label: "instance"
      - target_label: "__address__"
        replacement: "prometheus-blackbox-exporter:9115"
    static_configs:
      - targets: [ "prometheus.io", "grafana.com" ]
Similarly, the configuration below monitors HTTP servers. In this setup, if the HTTP response status is not in the 2xx range, the target is flagged as erroneous. You can insert this block into your prometheus.yml file under the scrape_configs section and update the targets array with the URLs you wish to monitor:
  - job_name: "blackbox-http"
    metrics_path: "/blackbox-exporter/probe"
    params:
      module: [ "http_2xx" ]
    relabel_configs:
      - source_labels: [ "__address__" ]
        target_label: "__param_target"
      - source_labels: [ "__param_target" ]
        target_label: "instance"
      - target_label: "__address__"
        replacement: "prometheus-blackbox-exporter:9115"
    static_configs:
      - targets: [ "https://prometheus.io/", "https://grafana.com/" ]
Once your scrape jobs are configured, you can review debug logs in the Blackbox UI. The link to the UI is available on your Stackhero dashboard, offering valuable insights into the probe results.
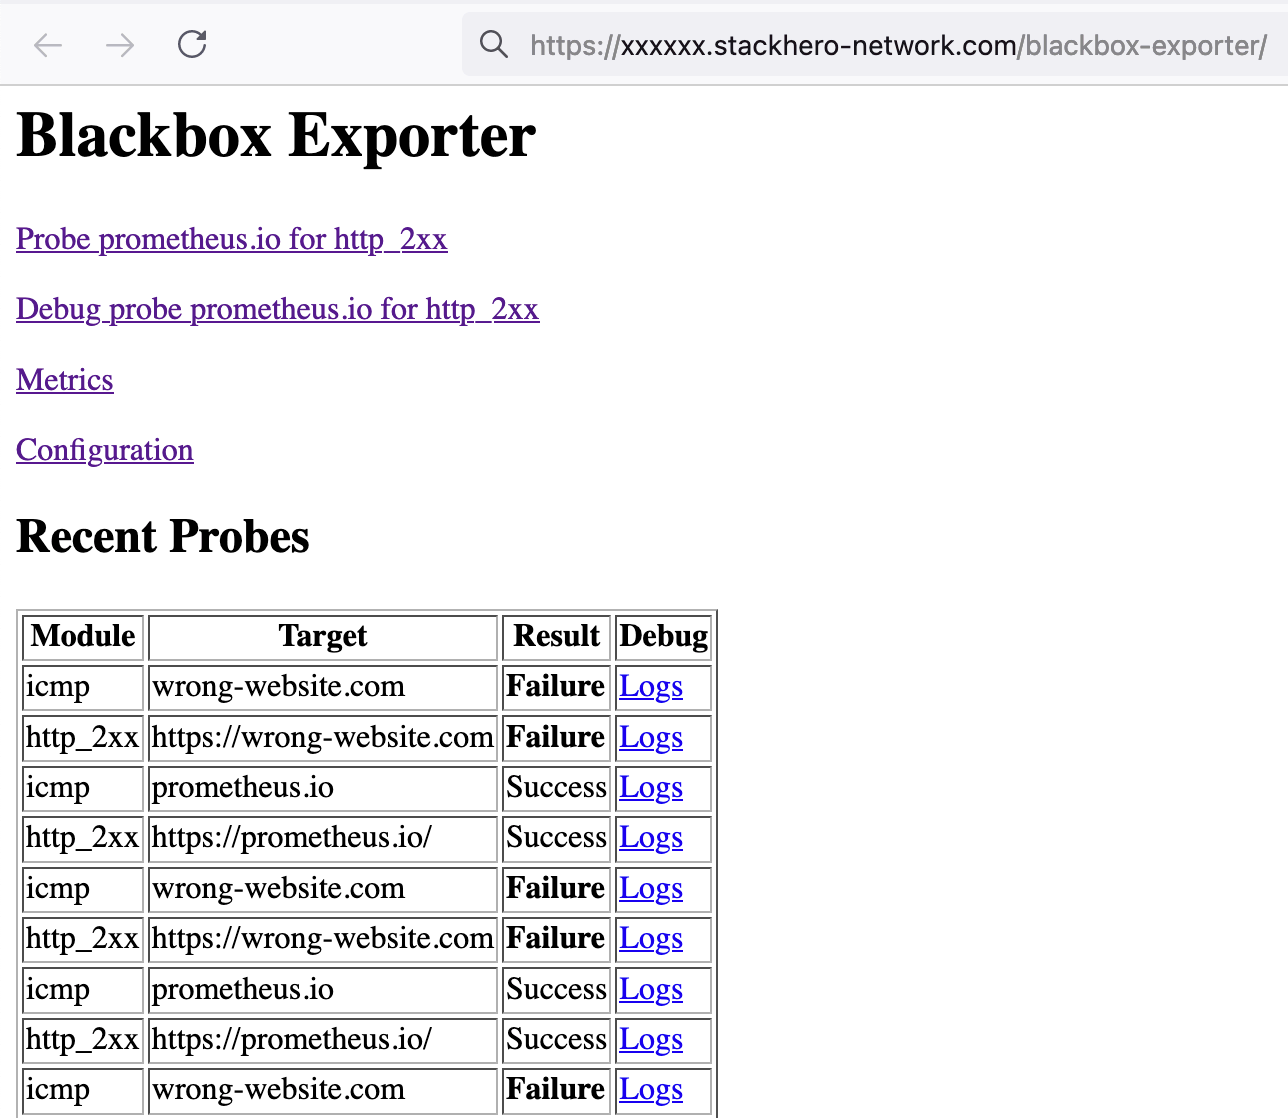 Blackbox UI showing the results of the last scrapes